- 世界
- »
- US
- »
- 佛羅里達州
- »
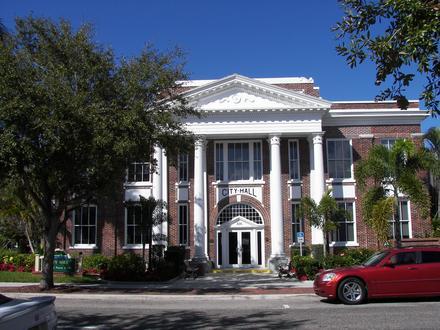
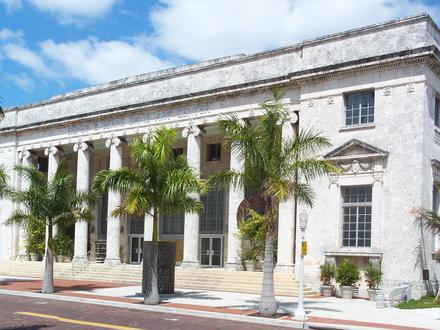
- Port Charlotte, 佛羅里達州
在Port Charlotte的企業
產業領域
行業分佈 購物中心: 17.1%
醫療: 16.6%
家庭服務: 12.3%
專業服務: 10.1%
行業: 7.4%
汽車: 5.9%
其他: 30.5%
| 行業說明 | 機構數 | 平均營業年齡 | Google平均評分 | 每千名居民的業務 |
|---|---|---|---|---|
| 汽車維修 | 184 | 30.3 年 | 4.2 | 3.2 |
| 发型师 | 116 | 26.7 年 | 4.3 | 2.0 |
| 美容院 | 105 | 25.3 年 | 4.4 | 1.9 |
| 公共行政 | 65 | 28.8 年 | 3.4 | 1.1 |
| 社會工作 | 82 | 27.6 年 | 4.0 | 1.4 |
| 借貸公司 | 129 | 35.3 年 | 4.2 | 2.3 |
| 資助其他 | 80 | 66.1 年 | 4.1 | 1.4 |
| 銀行 | 73 | 91.9 年 | 3.3 | 1.3 |
| 非同步傳輸模式 | 68 | 78.9 年 | 4.2 | 1.2 |
| 一般的清潔服務 | 82 | 23.3 年 | 4.5 | 1.4 |
| 其他建築 | 222 | 29.2 年 | 4.4 | 3.9 |
| 園林綠化 | 94 | 27.1 年 | 4.1 | 1.7 |
| 房地產 | 319 | 25.9 年 | 4.2 | 5.6 |
| 空調安裝和維修 | 62 | 25.6 年 | 4.3 | 1.1 |
| 總承包商 | 329 | 29.7 年 | 4.2 | 5.8 |
| 電氣安裝 | 65 | 27.6 年 | 4.5 | 1.1 |
| 房屋建造 | 160 | 31.8 年 | 4.0 | 2.8 |
| 維修其他 | 91 | 24.2 年 | 4.2 | 1.6 |
| 健康和醫療 | 1137 | 28.2 年 | 4.0 | 20.0 |
| 內科醫生和外科醫生 | 392 | 31.3 年 | 3.7 | 6.9 |
| 牙醫 | 117 | 29.7 年 | 4.5 | 2.1 |
| 理療 | 68 | 26.9 年 | 4.1 | 1.2 |
| 專業設計 | 71 | 22.8 年 | 4.5 | 1.3 |
| 律師 | 157 | 30.3 年 | 4.4 | 2.8 |
| 會計師 | 73 | 29.1 年 | 4.3 | 1.3 |
| 業務管理 | 89 | 27.8 年 | 4.4 | 1.6 |
| 科學和技術服務 | 143 | 24 年 | 4.6 | 2.5 |
| 教會 | 94 | 36.4 年 | 4.6 | 1.7 |
| 家用物品及設備 | 77 | 34.8 年 | 4.1 | 1.4 |
| 服裝店 | 64 | 34.3 年 | 4.1 | 1.1 |
| 硬件商店 | 84 | 40 年 | 4.1 | 1.5 |
| 藥房和藥店 | 96 | 39.1 年 | 4.1 | 1.7 |
| 購物-其他 | 126 | 34.4 年 | 4.2 | 2.2 |
| 電子商店 | 83 | 27 年 | 4.1 | 1.5 |
| Port Charlotte, 佛羅里達州地區 | 32.32 平方英里 |
| 人口 | 56742 |
| 男性人口 | 27248 (48%) |
| 女性人口 | 29494 (52%) |
| 從1975到2015的人口變化 | +12.3% |
| 從2000到2015的人口變化 | +18.2% |
| 年齡中位數 | 50.2 |
| 男性平均年齡 | 48.4 |
| 女性平均年齡 | 51.8 |
| 電話區號 | 941 |
| 鄰近社區 | Englewood East, Gardens of Gulf Cove, Gulf Cove, Port Charlotte, South Gulf Cove |
| 當地時間 | 星期三 10:05 |
| 時區 | 北美东部夏令时间 |
| 經度與緯度 | 26.97617° / -82.09064° |
| 郵編 | 33938, 33948, 33949, 33952, 33953, 更多 |
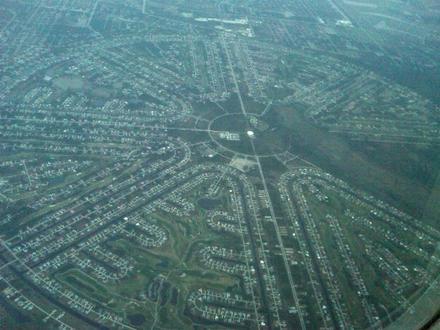
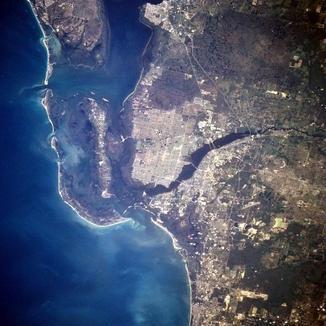
Port Charlotte, 佛羅里達州 -地圖
Port Charlotte, 佛羅里達州人口
1975年到2015年| 數據 | 1975 | 1990 | 2000 | 2015 |
|---|---|---|---|---|
| 人口 | 50525 | 40965 | 47996 | 56742 |
| 人口密度 | 1563 / mi² | 1267 / mi² | 1485 / mi² | 1755 / mi² |
Port Charlotte從2000到2015的人口變化
從2000年到2015年增長18.2%| 位置 | 1975以來的變化 | 1990以來的變化 | 2000以來的變化 |
|---|---|---|---|
| Port Charlotte, 佛羅里達州 | +12.3% | +38.5% | +18.2% |
| 佛羅里達州 | +95.6% | +51.7% | +26.2% |
| United States | +46.9% | +27.2% | +13.7% |
Port Charlotte, 佛羅里達州平均年齡
平均年齡:50.2 年| 位置 | 年齡中位數 | 中位年齡(女) | 中位年齡(男) |
|---|---|---|---|
| Port Charlotte, 佛羅里達州 | 50.2 年 | 51.8 年 | 48.4 年 |
| 佛羅里達州 | 41.8 年 | 43.2 年 | 40.4 年 |
| United States | 37.4 年 | 38.7 年 | 36.1 年 |
Port Charlotte, 佛羅里達州人口樹狀圖
年齡和性別的人口| 年齡 | 男性 | 女性 | 總 |
|---|---|---|---|
| 5歲以下 | 1263 | 1163 | 2426 |
| 5-9 | 1311 | 1305 | 2617 |
| 10-14 | 1541 | 1344 | 2886 |
| 15-19 | 1592 | 1544 | 3136 |
| 20-24 | 1277 | 1193 | 2471 |
| 25-29 | 1240 | 1224 | 2465 |
| 30-34 | 1233 | 1160 | 2394 |
| 35-39 | 1244 | 1279 | 2524 |
| 40-44 | 1586 | 1544 | 3131 |
| 45-49 | 1946 | 2134 | 4081 |
| 50-54 | 2025 | 2323 | 4349 |
| 55-59 | 2009 | 2387 | 4396 |
| 60-64 | 1986 | 2365 | 4351 |
| 65-69 | 1919 | 2155 | 4075 |
| 70-74 | 1675 | 1895 | 3571 |
| 75-79 | 1451 | 1553 | 3004 |
| 80-84 | 990 | 1399 | 2390 |
| 85加 | 959 | 1527 | 2486 |
Port Charlotte, 佛羅里達州人口密度
人口密度: 1755 / mi²| 位置 | 人口 | 區 | 人口密度 |
|---|---|---|---|
| Port Charlotte, 佛羅里達州 | 56742 | 32.32 平方英里 | 1755 / mi² |
| 佛羅里達州 | 20.3 million | 65,757.5 平方英里 | 308.1 / mi² |
| United States | 321.6 million | 3,796,761.2 平方英里 | 84.7 / mi² |
Port Charlotte, 佛羅里達州的預計人口
從1975到2100的估計人口Sources:
1. JRC (European Commission's Joint Research Centre) work on the GHS built-up grid
2. CIESIN (Center for International Earth Science Information Network)
3. [鏈接] Klein Goldewijk, K., Beusen, A., Doelman, J., and Stehfest, E.: Anthropogenic land use estimates for the Holocene – HYDE 3.2, Earth Syst. Sci. Data, 9, 927–953, https://doi.org/10.5194/essd-9-927-2017, 2017.
鄰近社區
Port Charlotte企業(按街區分佈) Englewood East: 33%
Port Charlotte: 21.5%
South Gulf Cove: 16.2%
Gulf Cove: 14.4%
Gardens of Gulf Cove: 5.3%
其他: 9.7%
Port Charlotte, 佛羅里達州企業(按價格分佈)
中等: 47%
便宜: 42.7%
昂貴: 7.5%
非常昂貴: 2.8%
人類發展指數(HDI)
預期壽命,教育程度和人均收入的統計綜合指數。Sources: [Link] Kummu, M., Taka, M. & Guillaume, J. Gridded global datasets for Gross Domestic Product and Human Development Index over 1990–2015. Sci Data 5, 180004 (2018) doi:10.1038/sdata.2018.4
Port Charlotte, 佛羅里達州二氧化碳排放
每年人均二氧化碳(CO2)排放量(噸)| 位置 | 二氧化碳排放量 | 人均二氧化碳排放量 | 二氧化碳排放強度 |
|---|---|---|---|
| Port Charlotte, 佛羅里達州 | 985,327 美噸 | 17.4 美噸 | 30,489 tn/mi² |
| 佛羅里達州 | 302,482,609 美噸 | 14.9 美噸 | 4,599 tn/mi² |
| United States | 5,664,619,809 美噸 | 17.6 美噸 | 1,491 tn/mi² |
Port Charlotte, 佛羅里達州二氧化碳排放
| 2013年二氧化碳排放量(噸/年) | 985,327 美噸 |
| 2013人均二氧化碳排放量(噸/年) | 17.4 美噸 |
| 2013二氧化碳排放強度(噸/平方英里/年) |
自然災害風險
相對風險(滿分10分)| 洪水 | 高(7) |
*風險可能並不涉及整個地區,尤其是洪水或山體滑坡。
Sources: 1. Dilley, M., R.S. Chen, U. Deichmann, A.L. Lerner-Lam, M. Arnold, J. Agwe, P. Buys, O. Kjekstad, B. Lyon, and G. Yetman. 2005. Natural Disaster Hotspots: A Global Risk Analysis. Washington, D.C.: World Bank. https://doi.org/10.1596/0-8213-5930-4.
2. Center for Hazards and Risk Research - CHRR - Columbia University, Center for International Earth Science Information Network - CIESIN - Columbia University. 2005. Global Flood Hazard Frequency and Distribution. Palisades, NY: NASA Socioeconomic Data and Applications Center (SEDAC). https://doi.org/10.7927/H4668B3D.
郵編
按郵編在Port Charlotte的企業百分比 郵編 33952: 38.5%
郵編 33948: 21.8%
郵編 33954: 10.6%
郵編 33980: 10.6%
郵編 33953: 10.5%
郵編 33981: 6.5%
其他: 1.5%
關於我們的數據
此頁面上的數據是使用許多公共可用工具和資源估算的。它不提供任何保修,並且可能包含不正確的地方。使用風險自負。有關更多信息,請參見此處 。