- 世界
- »
- US
- »
- 紐澤西州
- »
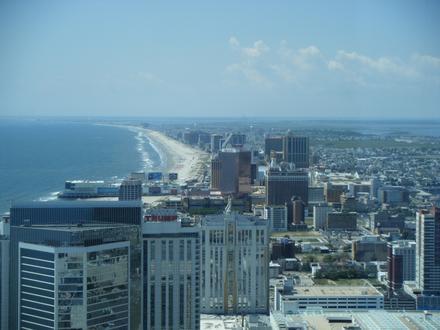
- Ocean City, 紐澤西州
在Ocean City的企業
產業領域
行業分佈 購物中心: 21.1%
家庭服務: 14%
餐廳: 11%
專業服務: 9.4%
行業: 6.4%
食物: 5.6%
酒店&旅行: 5.3%
醫療: 5.2%
其他: 21.9%
| 行業說明 | 機構數 | 平均營業年齡 | Google平均評分 | 每千名居民的業務 |
|---|---|---|---|---|
| 发型师 | 27 | 34 年 | 4.3 | 2.4 |
| 美容院 | 24 | 32 年 | 4.2 | 2.2 |
| 公共行政 | 27 | 49.8 年 | 4.0 | 2.4 |
| 借貸公司 | 29 | 30.9 年 | 4.0 | 2.6 |
| 資助其他 | 20 | 33.2 年 | 4.0 | 1.8 |
| 雜貨店和超市 | 39 | 41 年 | 4.4 | 3.5 |
| 麵包店 | 34 | 32.7 年 | 4.5 | 3.1 |
| 公寓 | 39 | 49.4 年 | 4.4 | 3.5 |
| 其他建築 | 69 | 31.3 年 | 3.9 | 6.2 |
| 房地產 | 159 | 39.9 年 | 4.4 | 14.4 |
| 水暖安裝及維修 | 20 | 34.1 年 | 4.5 | 1.8 |
| 總承包商 | 97 | 31.2 年 | 4.0 | 8.8 |
| 繪畫和油漆承包商 | 21 | 30 年 | 4.6 | 1.9 |
| 其他住宿 | 71 | 42 年 | 4.1 | 6.4 |
| 酒店和汽車旅館 | 62 | 39.5 年 | 4.2 | 5.6 |
| 其他成員組織 | 20 | 41.5 年 | 4.4 | 1.8 |
| 房屋建造 | 64 | 33.5 年 | 4.3 | 5.8 |
| 健康和醫療 | 118 | 30.1 年 | 4.6 | 10.7 |
| 內科醫生和外科醫生 | 40 | 27.6 年 | 3.5 | 3.6 |
| 牙醫 | 25 | 32.8 年 | 4.7 | 2.3 |
| 律師 | 43 | 36 年 | 4.3 | 3.9 |
| 業務管理 | 28 | 27 年 | 3.7 | 2.5 |
| 科學和技術服務 | 26 | 26.7 年 | 3.7 | 2.4 |
| 教會 | 33 | 65.8 年 | 4.8 | 3.0 |
| 咖啡館 | 33 | 23.4 年 | 4.3 | 3.0 |
| 比薩 | 29 | 34.6 年 | 4.3 | 2.6 |
| 美國餐館 | 29 | 41.9 年 | 4.3 | 2.6 |
| 義大利餐廳 | 22 | 38.3 年 | 4.3 | 2.0 |
| 女裝 | 22 | 38 年 | 2.8 | 2.0 |
| 家用物品及設備 | 25 | 40.8 年 | 4.6 | 2.3 |
| 服裝店 | 60 | 33.1 年 | 3.9 | 5.4 |
| 硬件商店 | 23 | 50.6 年 | 4.4 | 2.1 |
| 禮品,卡片和聚會用品 | 47 | 39.1 年 | 4.5 | 4.3 |
| 購物-其他 | 47 | 47.9 年 | 4.4 | 4.3 |
| 體育用品 | 33 | 42.4 年 | 4.2 | 3.0 |
| Ocean City, 紐澤西州地區 | 10.8 平方英里 |
| 人口 | 11041 |
| 男性人口 | 5138 (46.5%) |
| 女性人口 | 5903 (53.5%) |
| 從1975到2015的人口變化 | -13.9% |
| 從2000到2015的人口變化 | -8.7% |
| 年齡中位數 | 54.1 |
| 男性平均年齡 | 52.4 |
| 女性平均年齡 | 55.6 |
| 電話區號 | 609 |
| 鄰近社區 | Ocean City, The Board Walk, The Gardens, The Goldcoast |
| 當地時間 | 星期四 22:16 |
| 時區 | 北美东部夏令时间 |
| 經度與緯度 | 39.27762° / -74.5746° |
| 郵編 | 08226 |
Ocean City, 紐澤西州 -地圖
Ocean City, 紐澤西州人口
1975年到2015年| 數據 | 1975 | 1990 | 2000 | 2015 |
|---|---|---|---|---|
| 人口 | 12827 | 11080 | 12097 | 11041 |
| 人口密度 | 1188 / mi² | 1026 / mi² | 1120 / mi² | 1022 / mi² |
Ocean City從2000到2015的人口變化
從2000年到2015年下降8.7%| 位置 | 1975以來的變化 | 1990以來的變化 | 2000以來的變化 |
|---|---|---|---|
| Ocean City, 紐澤西州 | -13.9% | -0.4% | -8.7% |
| 紐澤西州 | +26% | +13.4% | +5.2% |
| United States | +46.9% | +27.2% | +13.7% |
Ocean City, 紐澤西州平均年齡
平均年齡:54.1 年| 位置 | 年齡中位數 | 中位年齡(女) | 中位年齡(男) |
|---|---|---|---|
| Ocean City, 紐澤西州 | 54.1 年 | 55.6 年 | 52.4 年 |
| 紐澤西州 | 38.9 年 | 40.4 年 | 37.4 年 |
| United States | 37.4 年 | 38.7 年 | 36.1 年 |
Ocean City, 紐澤西州人口樹狀圖
年齡和性別的人口| 年齡 | 男性 | 女性 | 總 |
|---|---|---|---|
| 5歲以下 | 160 | 180 | 340 |
| 5-9 | 195 | 205 | 400 |
| 10-14 | 248 | 243 | 492 |
| 15-19 | 277 | 257 | 534 |
| 20-24 | 269 | 236 | 506 |
| 25-29 | 270 | 223 | 493 |
| 30-34 | 192 | 216 | 408 |
| 35-39 | 175 | 188 | 364 |
| 40-44 | 248 | 248 | 496 |
| 45-49 | 327 | 380 | 708 |
| 50-54 | 431 | 514 | 945 |
| 55-59 | 450 | 503 | 953 |
| 60-64 | 513 | 546 | 1060 |
| 65-69 | 412 | 506 | 918 |
| 70-74 | 312 | 369 | 681 |
| 75-79 | 284 | 358 | 643 |
| 80-84 | 201 | 395 | 596 |
| 85加 | 176 | 337 | 513 |
Ocean City, 紐澤西州人口密度
人口密度: 1022 / mi²| 位置 | 人口 | 區 | 人口密度 |
|---|---|---|---|
| Ocean City, 紐澤西州 | 11041 | 10.8 平方英里 | 1022 / mi² |
| 紐澤西州 | 8.9 million | 8,722.6 平方英里 | 1019 / mi² |
| United States | 321.6 million | 3,796,761.2 平方英里 | 84.7 / mi² |
鄰近社區
Ocean City企業(按街區分佈) The Board Walk: 65.3%
Ocean City: 20.9%
The Goldcoast: 4.9%
其他: 8.9%
區號
Ocean City的企業使用的區碼百分比 電話區號 609: 83.5%
電話區號 732: 13.6%
其他: 2.9%
Ocean City, 紐澤西州企業(按價格分佈)
中等: 54.5%
便宜: 34.3%
昂貴: 6.9%
非常昂貴: 4.2%
人類發展指數(HDI)
預期壽命,教育程度和人均收入的統計綜合指數。Sources: [Link] Kummu, M., Taka, M. & Guillaume, J. Gridded global datasets for Gross Domestic Product and Human Development Index over 1990–2015. Sci Data 5, 180004 (2018) doi:10.1038/sdata.2018.4
Ocean City, 紐澤西州二氧化碳排放
每年人均二氧化碳(CO2)排放量(噸)| 位置 | 二氧化碳排放量 | 人均二氧化碳排放量 | 二氧化碳排放強度 |
|---|---|---|---|
| Ocean City, 紐澤西州 | 452,072 美噸 | 40.9 美噸 | 41,870 tn/mi² |
| 紐澤西州 | 148,066,841 美噸 | 16.6 美噸 | 16,975 tn/mi² |
| United States | 5,664,619,809 美噸 | 17.6 美噸 | 1,491 tn/mi² |
Ocean City, 紐澤西州二氧化碳排放
| 2013年二氧化碳排放量(噸/年) | 452,072 美噸 |
| 2013人均二氧化碳排放量(噸/年) | 40.9 美噸 |
| 2013二氧化碳排放強度(噸/平方英里/年) |
自然災害風險
相對風險(滿分10分)| 氣旋 | 高(8) |
| 洪水 | 平均值(4) |
*風險可能並不涉及整個地區,尤其是洪水或山體滑坡。
Sources: 1. Dilley, M., R.S. Chen, U. Deichmann, A.L. Lerner-Lam, M. Arnold, J. Agwe, P. Buys, O. Kjekstad, B. Lyon, and G. Yetman. 2005. Natural Disaster Hotspots: A Global Risk Analysis. Washington, D.C.: World Bank. https://doi.org/10.1596/0-8213-5930-4.
2. Center for Hazards and Risk Research - CHRR - Columbia University, Center for International Earth Science Information Network - CIESIN - Columbia University, International Bank for Reconstruction and Development - The World Bank, and United Nations Environment Programme Global Resource Information Database Geneva - UNEP/GRID-Geneva. 2005. Global Cyclone Hazard Frequency and Distribution. Palisades, NY: NASA Socioeconomic Data and Applications Center (SEDAC). https://doi.org/10.7927/H4CZ353K.
3. Center for Hazards and Risk Research - CHRR - Columbia University, Center for International Earth Science Information Network - CIESIN - Columbia University. 2005. Global Flood Hazard Frequency and Distribution. Palisades, NY: NASA Socioeconomic Data and Applications Center (SEDAC). https://doi.org/10.7927/H4668B3D.
最近的附近地震
幅度3.0以上郵編
按郵編在Ocean City的企業百分比 郵編 08226: 85.4%
郵編 07712: 14.2%
其他: 0.3%

關於我們的數據
此頁面上的數據是使用許多公共可用工具和資源估算的。它不提供任何保修,並且可能包含不正確的地方。使用風險自負。有關更多信息,請參見此處 。