- 世界
- »
- US
- »
- 紐約州
- »
- Millerton, 紐約州
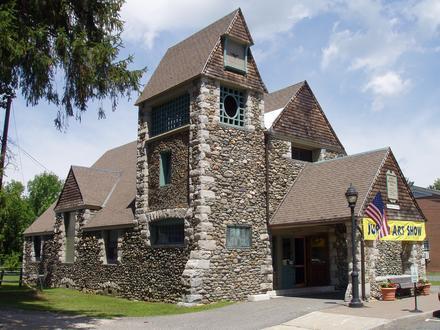
在Millerton的企業
產業領域
行業分佈 購物中心: 23.4%
專業服務: 11.4%
行業: 8.3%
食物: 7.5%
家庭服務: 7.3%
餐廳: 6.8%
汽車: 5.7%
其他: 29.5%
| 行業說明 | 機構數 | 平均營業年齡 | Google平均評分 | 每千名居民的業務 |
|---|---|---|---|---|
| 加油站 | 6 | 4.0 | 6.2 | |
| 汽車維修 | 10 | 64.9 年 | 4.3 | 10.3 |
| 发型师 | 9 | 28.3 年 | 4.8 | 9.3 |
| 美容院 | 10 | 31.1 年 | 4.7 | 10.3 |
| 公共行政 | 9 | 45.7 年 | 4.6 | 9.3 |
| 藝術畫廊 | 10 | 26.5 年 | 5.0 | 10.3 |
| 非同步傳輸模式 | 5 | 2.7 | 5.1 | |
| 雜貨店和超市 | 14 | 30.1 年 | 4.6 | 14.4 |
| 其他建築 | 5 | 4.7 | 5.1 | |
| 總承包商 | 14 | 41.5 年 | 4.8 | 14.4 |
| 其他成員組織 | 6 | 26.3 年 | 4.8 | 6.2 |
| 房屋建造 | 11 | 33.9 年 | 4.6 | 11.3 |
| 拖拉機和農用設備 | 10 | 34.9 年 | 4.6 | 10.3 |
| 健康和醫療 | 5 | 5.0 | 5.1 | |
| 律師 | 8 | 37.7 年 | 3.3 | 8.2 |
| 業務管理 | 5 | 5.1 | ||
| 教會 | 6 | 54.7 年 | 5.0 | 6.2 |
| 咖啡館 | 5 | 4.7 | 5.1 | |
| 美國餐館 | 6 | 4.3 | 6.2 | |
| 古董 | 8 | 53.1 年 | 4.3 | 8.2 |
| 家用物品及設備 | 8 | 82.2 年 | 4.0 | 8.2 |
| 禮品,卡片和聚會用品 | 9 | 46 年 | 5.0 | 9.3 |
| 購物-其他 | 12 | 61.5 年 | 4.4 | 12.4 |
| 電子商店 | 6 | 33.7 年 | 6.2 |
| Millerton, 紐約州地區 | 0.622 平方英里 |
| 人口 | 971 |
| 男性人口 | 480 (49.4%) |
| 女性人口 | 491 (50.6%) |
| 從1975到2015的人口變化 | +6.5% |
| 從2000到2015的人口變化 | +7.4% |
| 年齡中位數 | 39.2 |
| 男性平均年齡 | 37.4 |
| 女性平均年齡 | 40.9 |
| 電話區號 | 518, 845 |
| 鄰近社區 | Millerton |
| 當地時間 | 星期日 02:04 |
| 時區 | 北美东部夏令时间 |
| 經度與緯度 | 41.9537° / -73.51068° |
| 郵編 | 12546 |
Millerton, 紐約州 -地圖
Millerton, 紐約州人口
1975年到2015年| 數據 | 1975 | 1990 | 2000 | 2015 |
|---|---|---|---|---|
| 人口 | 912 | 874 | 904 | 971 |
| 人口密度 | 1467 / mi² | 1405 / mi² | 1454 / mi² | 1562 / mi² |
Millerton從2000到2015的人口變化
從2000年到2015年增長7.4%| 位置 | 1975以來的變化 | 1990以來的變化 | 2000以來的變化 |
|---|---|---|---|
| Millerton, 紐約州 | +6.5% | +11.1% | +7.4% |
| 紐約州 | +15.2% | +7.1% | +1.6% |
| United States | +46.9% | +27.2% | +13.7% |
Millerton, 紐約州平均年齡
平均年齡:39.2 年| 位置 | 年齡中位數 | 中位年齡(女) | 中位年齡(男) |
|---|---|---|---|
| Millerton, 紐約州 | 39.2 年 | 40.9 年 | 37.4 年 |
| 紐約州 | 38.1 年 | 39.6 年 | 36.6 年 |
| United States | 37.4 年 | 38.7 年 | 36.1 年 |
Millerton, 紐約州人口樹狀圖
年齡和性別的人口| 年齡 | 男性 | 女性 | 總 |
|---|---|---|---|
| 5歲以下 | 21 | 31 | 53 |
| 5-9 | 30 | 27 | 58 |
| 10-14 | 27 | 31 | 59 |
| 15-19 | 37 | 30 | 67 |
| 20-24 | 29 | 31 | 61 |
| 25-29 | 41 | 28 | 69 |
| 30-34 | 43 | 32 | 75 |
| 35-39 | 28 | 30 | 58 |
| 40-44 | 34 | 26 | 61 |
| 45-49 | 47 | 46 | 94 |
| 50-54 | 33 | 42 | 75 |
| 55-59 | 27 | 36 | 64 |
| 60-64 | 28 | 31 | 60 |
| 65-69 | 11 | 29 | 41 |
| 70-74 | 21 | 9 | 31 |
| 75-79 | 14 | 9 | 23 |
| 80-84 | 5 | 15 | 20 |
| 85加 | 6 | 7 | 13 |
Millerton, 紐約州人口密度
人口密度: 1562 / mi²| 位置 | 人口 | 區 | 人口密度 |
|---|---|---|---|
| Millerton, 紐約州 | 971 | 0.622 平方英里 | 1562 / mi² |
| 紐約州 | 19.4 million | 54,555.3 平方英里 | 355.2 / mi² |
| United States | 321.6 million | 3,796,761.2 平方英里 | 84.7 / mi² |
Millerton, 紐約州的歷史和預計人口
從1710到2100的估計人口Sources:
1. JRC (European Commission's Joint Research Centre) work on the GHS built-up grid
2. CIESIN (Center for International Earth Science Information Network)
3. [鏈接] Klein Goldewijk, K., Beusen, A., Doelman, J., and Stehfest, E.: Anthropogenic land use estimates for the Holocene – HYDE 3.2, Earth Syst. Sci. Data, 9, 927–953, https://doi.org/10.5194/essd-9-927-2017, 2017.
區號
Millerton的企業使用的區碼百分比 電話區號 518: 86.7%
電話區號 845: 8.2%
其他: 5.1%
Millerton, 紐約州企業(按價格分佈)
中等: 43.6%
便宜: 35.9%
昂貴: 12.8%
非常昂貴: 7.7%
人類發展指數(HDI)
預期壽命,教育程度和人均收入的統計綜合指數。Sources: [Link] Kummu, M., Taka, M. & Guillaume, J. Gridded global datasets for Gross Domestic Product and Human Development Index over 1990–2015. Sci Data 5, 180004 (2018) doi:10.1038/sdata.2018.4
Millerton, 紐約州二氧化碳排放
每年人均二氧化碳(CO2)排放量(噸)| 位置 | 二氧化碳排放量 | 人均二氧化碳排放量 | 二氧化碳排放強度 |
|---|---|---|---|
| Millerton, 紐約州 | 17,271 美噸 | 17.8 美噸 | 27,784 tn/mi² |
| 紐約州 | 334,299,374 美噸 | 17.3 美噸 | 6,127 tn/mi² |
| United States | 5,664,619,809 美噸 | 17.6 美噸 | 1,491 tn/mi² |
Millerton, 紐約州二氧化碳排放
| 2013年二氧化碳排放量(噸/年) | 17,271 美噸 |
| 2013人均二氧化碳排放量(噸/年) | 17.8 美噸 |
| 2013二氧化碳排放強度(噸/平方英里/年) |
自然災害風險
相對風險(滿分10分)| 氣旋 | 平均值(5) |
| 洪水 | 高(7) |
| 地震 | 低 (2) |
*風險可能並不涉及整個地區,尤其是洪水或山體滑坡。
Sources: 1. Dilley, M., R.S. Chen, U. Deichmann, A.L. Lerner-Lam, M. Arnold, J. Agwe, P. Buys, O. Kjekstad, B. Lyon, and G. Yetman. 2005. Natural Disaster Hotspots: A Global Risk Analysis. Washington, D.C.: World Bank. https://doi.org/10.1596/0-8213-5930-4.
2. Center for Hazards and Risk Research - CHRR - Columbia University, Center for International Earth Science Information Network - CIESIN - Columbia University. 2005. Global Earthquake Hazard Distribution - Peak Ground Acceleration. Palisades, NY: NASA Socioeconomic Data and Applications Center (SEDAC). https://doi.org/10.7927/H4BZ63ZS.
3. Center for Hazards and Risk Research - CHRR - Columbia University, Center for International Earth Science Information Network - CIESIN - Columbia University, International Bank for Reconstruction and Development - The World Bank, and United Nations Environment Programme Global Resource Information Database Geneva - UNEP/GRID-Geneva. 2005. Global Cyclone Hazard Frequency and Distribution. Palisades, NY: NASA Socioeconomic Data and Applications Center (SEDAC). https://doi.org/10.7927/H4CZ353K.
4. Center for Hazards and Risk Research - CHRR - Columbia University, Center for International Earth Science Information Network - CIESIN - Columbia University. 2005. Global Flood Hazard Frequency and Distribution. Palisades, NY: NASA Socioeconomic Data and Applications Center (SEDAC). https://doi.org/10.7927/H4668B3D.
最近的附近地震
幅度3.0以上| 日 | 時間 | 大小 | 距離 | 深度 | 位置 | 鏈接 |
|---|---|---|---|---|---|---|
| 2009/12/13 | 下午2:00 | 3.15 | 84.6 公里 | 10,180 公尺 | New York | usgs.gov |
| 2009/5/17 | 下午5:53 | 3.05 | 84.6 公里 | 8,610 公尺 | New York | usgs.gov |
| 2007/7/23 | 下午6:56 | 3.05 | 88 公里 | 15,150 公尺 | New York | usgs.gov |
| 2000/6/15 | 晚上9:02 | 3.3 | 59.5 公里 | 9,800 公尺 | southern New England | usgs.gov |
| 1980/10/24 | 上午10:27 | 3.1 | 89.7 公里 | None | southern New England | usgs.gov |
| 1974/6/7 | 中午12:45 | 3.3 | 55.5 公里 | 2,000 公尺 | New York | usgs.gov |

關於我們的數據
此頁面上的數據是使用許多公共可用工具和資源估算的。它不提供任何保修,並且可能包含不正確的地方。使用風險自負。有關更多信息,請參見此處 。