- 世界
- »
- US
- »
- 紐約州
- »
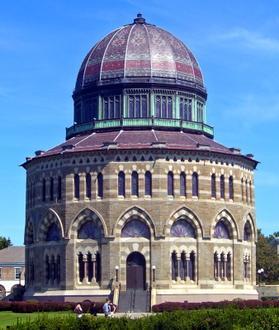
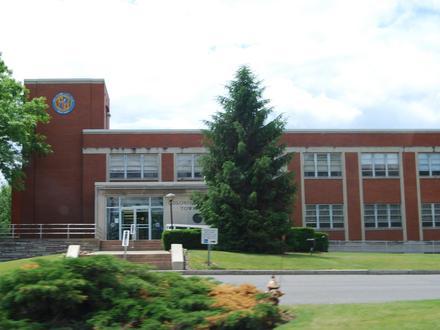
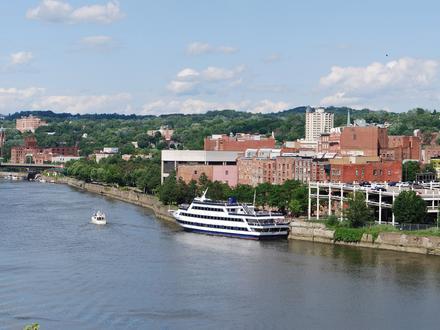
- Karner, 紐約州
在Karner的企業
| Karner, 紐約州地區 | 11.52 平方英里 |
| 人口 | 17109 |
| 男性人口 | 8037 (47%) |
| 女性人口 | 9072 (53%) |
| 從1975到2015的人口變化 | +21.7% |
| 從2000到2015的人口變化 | +3.4% |
| 年齡中位數 | 45.2 |
| 男性平均年齡 | 42.9 |
| 女性平均年齡 | 47.3 |
| 當地時間 | 星期日 02:04 |
| 時區 | 北美东部夏令时间 |
| 經度與緯度 | 42.72341° / -73.85734° |
Karner, 紐約州 -地圖
Karner, 紐約州人口
1975年到2015年| 數據 | 1975 | 1990 | 2000 | 2015 |
|---|---|---|---|---|
| 人口 | 14053 | 14938 | 16542 | 17109 |
| 人口密度 | 1219 / mi² | 1296 / mi² | 1435 / mi² | 1484 / mi² |
Karner從2000到2015的人口變化
從2000年到2015年增長3.4%| 位置 | 1975以來的變化 | 1990以來的變化 | 2000以來的變化 |
|---|---|---|---|
| Karner, 紐約州 | +21.7% | +14.5% | +3.4% |
| 紐約州 | +15.2% | +7.1% | +1.6% |
| United States | +46.9% | +27.2% | +13.7% |
Karner, 紐約州平均年齡
平均年齡:45.2 年| 位置 | 年齡中位數 | 中位年齡(女) | 中位年齡(男) |
|---|---|---|---|
| Karner, 紐約州 | 45.2 年 | 47.3 年 | 42.9 年 |
| 紐約州 | 38.1 年 | 39.6 年 | 36.6 年 |
| United States | 37.4 年 | 38.7 年 | 36.1 年 |
Karner, 紐約州人口樹狀圖
年齡和性別的人口| 年齡 | 男性 | 女性 | 總 |
|---|---|---|---|
| 5歲以下 | 387 | 389 | 777 |
| 5-9 | 452 | 375 | 828 |
| 10-14 | 510 | 464 | 974 |
| 15-19 | 508 | 486 | 995 |
| 20-24 | 414 | 397 | 812 |
| 25-29 | 448 | 492 | 941 |
| 30-34 | 496 | 446 | 943 |
| 35-39 | 466 | 531 | 997 |
| 40-44 | 581 | 617 | 1199 |
| 45-49 | 680 | 723 | 1404 |
| 50-54 | 651 | 708 | 1360 |
| 55-59 | 648 | 693 | 1341 |
| 60-64 | 540 | 641 | 1181 |
| 65-69 | 356 | 422 | 778 |
| 70-74 | 265 | 344 | 609 |
| 75-79 | 235 | 353 | 589 |
| 80-84 | 192 | 391 | 583 |
| 85加 | 208 | 600 | 809 |
Karner, 紐約州人口密度
人口密度: 1484 / mi²| 位置 | 人口 | 區 | 人口密度 |
|---|---|---|---|
| Karner, 紐約州 | 17109 | 11.52 平方英里 | 1484 / mi² |
| 紐約州 | 19.4 million | 54,555.3 平方英里 | 355.2 / mi² |
| United States | 321.6 million | 3,796,761.2 平方英里 | 84.7 / mi² |
Karner, 紐約州的預計人口
從1975到2100的估計人口Sources:
1. JRC (European Commission's Joint Research Centre) work on the GHS built-up grid
2. CIESIN (Center for International Earth Science Information Network)
3. [鏈接] Klein Goldewijk, K., Beusen, A., Doelman, J., and Stehfest, E.: Anthropogenic land use estimates for the Holocene – HYDE 3.2, Earth Syst. Sci. Data, 9, 927–953, https://doi.org/10.5194/essd-9-927-2017, 2017.
人類發展指數(HDI)
預期壽命,教育程度和人均收入的統計綜合指數。Sources: [Link] Kummu, M., Taka, M. & Guillaume, J. Gridded global datasets for Gross Domestic Product and Human Development Index over 1990–2015. Sci Data 5, 180004 (2018) doi:10.1038/sdata.2018.4
Karner, 紐約州二氧化碳排放
每年人均二氧化碳(CO2)排放量(噸)| 位置 | 二氧化碳排放量 | 人均二氧化碳排放量 | 二氧化碳排放強度 |
|---|---|---|---|
| Karner, 紐約州 | 261,030 美噸 | 15.3 美噸 | 22,651 tn/mi² |
| 紐約州 | 334,299,374 美噸 | 17.3 美噸 | 6,127 tn/mi² |
| United States | 5,664,619,809 美噸 | 17.6 美噸 | 1,491 tn/mi² |
Karner, 紐約州二氧化碳排放
| 2013年二氧化碳排放量(噸/年) | 261,030 美噸 |
| 2013人均二氧化碳排放量(噸/年) | 15.3 美噸 |
| 2013二氧化碳排放強度(噸/平方英里/年) |
自然災害風險
相對風險(滿分10分)| 洪水 | 高(8) |
| 地震 | 低 (2) |
*風險可能並不涉及整個地區,尤其是洪水或山體滑坡。
Sources: 1. Dilley, M., R.S. Chen, U. Deichmann, A.L. Lerner-Lam, M. Arnold, J. Agwe, P. Buys, O. Kjekstad, B. Lyon, and G. Yetman. 2005. Natural Disaster Hotspots: A Global Risk Analysis. Washington, D.C.: World Bank. https://doi.org/10.1596/0-8213-5930-4.
2. Center for Hazards and Risk Research - CHRR - Columbia University, Center for International Earth Science Information Network - CIESIN - Columbia University. 2005. Global Earthquake Hazard Distribution - Peak Ground Acceleration. Palisades, NY: NASA Socioeconomic Data and Applications Center (SEDAC). https://doi.org/10.7927/H4BZ63ZS.
3. Center for Hazards and Risk Research - CHRR - Columbia University, Center for International Earth Science Information Network - CIESIN - Columbia University. 2005. Global Flood Hazard Frequency and Distribution. Palisades, NY: NASA Socioeconomic Data and Applications Center (SEDAC). https://doi.org/10.7927/H4668B3D.
最近的附近地震
幅度3.0以上| 日 | 時間 | 大小 | 距離 | 深度 | 位置 | 鏈接 |
|---|---|---|---|---|---|---|
| 2009/12/13 | 下午2:00 | 3.15 | 26.5 公里 | 10,180 公尺 | New York | usgs.gov |
| 2009/5/17 | 下午5:53 | 3.05 | 26.8 公里 | 8,610 公尺 | New York | usgs.gov |
| 2007/7/23 | 下午6:56 | 3.05 | 25.2 公里 | 15,150 公尺 | New York | usgs.gov |
| 1991/6/17 | 凌晨1:53 | 4 | 68.1 公里 | 5,000 公尺 | New York | usgs.gov |
| 1984/10/22 | 晚上11:26 | 3.4 | 96.7 公里 | 1,000 公尺 | New York | usgs.gov |
| 1931/4/20 | 上午11:54 | 4.7 | 83.3 公里 | 5,000 公尺 | New York | usgs.gov |
| 1916/2/2 | 晚上8:24 | 4.1 | 32.9 公里 | None | New York | usgs.gov |

關於我們的數據
此頁面上的數據是使用許多公共可用工具和資源估算的。它不提供任何保修,並且可能包含不正確的地方。使用風險自負。有關更多信息,請參見此處 。