- 世界
- »
- US
- »
- 佐治亞州
- »
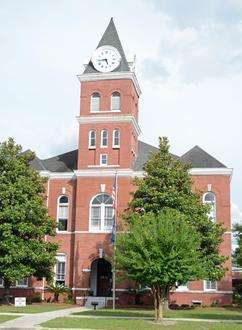
- Hinesville, 佐治亞州
在Hinesville的企業
產業領域
行業分佈 購物中心: 17%
醫療: 11.6%
家庭服務: 9.4%
專業服務: 7.6%
餐廳: 7.6%
汽車: 6.7%
美容與水療: 5.4%
行業: 5.2%
社區與政府: 5%
其他: 24.4%
| 行業說明 | 機構數 | 平均營業年齡 | Google平均評分 | 每千名居民的業務 |
|---|---|---|---|---|
| 加油站 | 29 | 34.8 年 | 4.0 | 0.9 |
| 汽車維修 | 80 | 34.8 年 | 4.1 | 2.4 |
| 汽車配件 | 32 | 41.8 年 | 4.0 | 1.0 |
| 发型师 | 63 | 28.3 年 | 4.0 | 1.9 |
| 美容院 | 68 | 22.8 年 | 4.0 | 2.0 |
| 公共行政 | 72 | 54.4 年 | 3.3 | 2.1 |
| 社會工作 | 36 | 30.6 年 | 3.6 | 1.1 |
| 借貸公司 | 42 | 44.7 年 | 4.5 | 1.3 |
| 資助其他 | 36 | 49.9 年 | 4.3 | 1.1 |
| 銀行 | 21 | 60.4 年 | 3.3 | 0.6 |
| 便利店 | 26 | 32.2 年 | 4.1 | 0.8 |
| 雜貨店和超市 | 30 | 33.6 年 | 4.1 | 0.9 |
| 公寓 | 33 | 36.3 年 | 3.4 | 1.0 |
| 其他建築 | 37 | 38.9 年 | 3.9 | 1.1 |
| 房地產 | 123 | 29 年 | 3.5 | 3.7 |
| 總承包商 | 70 | 28.7 年 | 4.1 | 2.1 |
| 其他住宿 | 23 | 29.9 年 | 3.8 | 0.7 |
| 其他成員組織 | 20 | 38.6 年 | 4.1 | 0.6 |
| 房屋建造 | 48 | 33.2 年 | 4.1 | 1.4 |
| 兒童護理及日間護理 | 21 | 28.4 年 | 4.1 | 0.6 |
| 健康和醫療 | 264 | 28.7 年 | 3.7 | 7.9 |
| 內科醫生和外科醫生 | 94 | 26.3 年 | 3.0 | 2.8 |
| 牙醫 | 32 | 27.1 年 | 4.3 | 1.0 |
| 醫院 | 21 | 35.3 年 | 3.8 | 0.6 |
| 律師 | 36 | 32.2 年 | 4.4 | 1.1 |
| 會計師 | 32 | 35.4 年 | 4.0 | 1.0 |
| 教會 | 84 | 46 年 | 4.4 | 2.5 |
| 家用物品及設備 | 22 | 36.5 年 | 4.0 | 0.7 |
| 服裝店 | 35 | 29.9 年 | 4.3 | 1.0 |
| 百貨商場 | 21 | 41.1 年 | 4.1 | 0.6 |
| 藥房和藥店 | 25 | 29.8 年 | 4.0 | 0.7 |
| 購物-其他 | 56 | 35.6 年 | 4.1 | 1.7 |
| 電子商店 | 24 | 35.7 年 | 4.0 | 0.7 |
| Hinesville, 佐治亞州地區 | 16.33 平方英里 |
| 人口 | 33540 |
| 男性人口 | 15829 (47.2%) |
| 女性人口 | 17711 (52.8%) |
| 從1975到2015的人口變化 | +22.2% |
| 從2000到2015的人口變化 | +2.9% |
| 年齡中位數 | 28.3 |
| 男性平均年齡 | 27 |
| 女性平均年齡 | 29.4 |
| 電話區號 | 912 |
| 鄰近社區 | Downtown Hinesville, Hinesville |
| 當地時間 | 星期四 22:34 |
| 時區 | 北美东部夏令时间 |
| 經度與緯度 | 31.84688° / -81.59595° |
| 郵編 | 31310, 31313 |
Hinesville, 佐治亞州 -地圖
Hinesville, 佐治亞州人口
1975年到2015年| 數據 | 1975 | 1990 | 2000 | 2015 |
|---|---|---|---|---|
| 人口 | 27443 | 24430 | 32602 | 33540 |
| 人口密度 | 1680 / mi² | 1495 / mi² | 1996 / mi² | 2053 / mi² |
Hinesville從2000到2015的人口變化
從2000年到2015年增長2.9%| 位置 | 1975以來的變化 | 1990以來的變化 | 2000以來的變化 |
|---|---|---|---|
| Hinesville, 佐治亞州 | +22.2% | +37.3% | +2.9% |
| 喬治亞州 | +93.8% | +53.1% | +27.8% |
| United States | +46.9% | +27.2% | +13.7% |
Hinesville, 佐治亞州平均年齡
平均年齡:28.3 年| 位置 | 年齡中位數 | 中位年齡(女) | 中位年齡(男) |
|---|---|---|---|
| Hinesville, 佐治亞州 | 28.3 年 | 29.4 年 | 27 年 |
| 喬治亞州 | 35.4 年 | 36.6 年 | 34.2 年 |
| United States | 37.4 年 | 38.7 年 | 36.1 年 |
Hinesville, 佐治亞州人口樹狀圖
年齡和性別的人口| 年齡 | 男性 | 女性 | 總 |
|---|---|---|---|
| 5歲以下 | 1749 | 1710 | 3460 |
| 5-9 | 1469 | 1298 | 2768 |
| 10-14 | 1290 | 1203 | 2493 |
| 15-19 | 1240 | 1323 | 2563 |
| 20-24 | 1552 | 1763 | 3316 |
| 25-29 | 1528 | 1787 | 3316 |
| 30-34 | 1114 | 1300 | 2414 |
| 35-39 | 890 | 1169 | 2060 |
| 40-44 | 868 | 1135 | 2003 |
| 45-49 | 1023 | 1292 | 2316 |
| 50-54 | 1001 | 1122 | 2123 |
| 55-59 | 795 | 939 | 1734 |
| 60-64 | 566 | 596 | 1163 |
| 65-69 | 360 | 443 | 804 |
| 70-74 | 175 | 276 | 452 |
| 75-79 | 96 | 153 | 250 |
| 80-84 | 71 | 118 | 190 |
| 85加 | 43 | 83 | 126 |
Hinesville, 佐治亞州人口密度
人口密度: 2053 / mi²| 位置 | 人口 | 區 | 人口密度 |
|---|---|---|---|
| Hinesville, 佐治亞州 | 33540 | 16.33 平方英里 | 2053 / mi² |
| 喬治亞州 | 10.5 million | 59,425.5 平方英里 | 176.8 / mi² |
| United States | 321.6 million | 3,796,761.2 平方英里 | 84.7 / mi² |
Hinesville, 佐治亞州的預計人口
從1975到2100的估計人口Sources:
1. JRC (European Commission's Joint Research Centre) work on the GHS built-up grid
2. CIESIN (Center for International Earth Science Information Network)
3. [鏈接] Klein Goldewijk, K., Beusen, A., Doelman, J., and Stehfest, E.: Anthropogenic land use estimates for the Holocene – HYDE 3.2, Earth Syst. Sci. Data, 9, 927–953, https://doi.org/10.5194/essd-9-927-2017, 2017.
鄰近社區
Hinesville企業(按街區分佈) Downtown Hinesville: 69.8%
Hinesville: 14.6%
其他: 15.6%
Hinesville, 佐治亞州企業(按價格分佈)
便宜: 52.3%
中等: 38.4%
昂貴: 6.3%
非常昂貴: 3%
人類發展指數(HDI)
預期壽命,教育程度和人均收入的統計綜合指數。Sources: [Link] Kummu, M., Taka, M. & Guillaume, J. Gridded global datasets for Gross Domestic Product and Human Development Index over 1990–2015. Sci Data 5, 180004 (2018) doi:10.1038/sdata.2018.4
Hinesville, 佐治亞州二氧化碳排放
每年人均二氧化碳(CO2)排放量(噸)| 位置 | 二氧化碳排放量 | 人均二氧化碳排放量 | 二氧化碳排放強度 |
|---|---|---|---|
| Hinesville, 佐治亞州 | 514,379 美噸 | 15.3 美噸 | 31,494 tn/mi² |
| 喬治亞州 | 183,571,844 美噸 | 17.5 美噸 | 3,089 tn/mi² |
| United States | 5,664,619,809 美噸 | 17.6 美噸 | 1,491 tn/mi² |
Hinesville, 佐治亞州二氧化碳排放
| 2013年二氧化碳排放量(噸/年) | 514,379 美噸 |
| 2013人均二氧化碳排放量(噸/年) | 15.3 美噸 |
| 2013二氧化碳排放強度(噸/平方英里/年) |
自然災害風險
相對風險(滿分10分)| 氣旋 | 高(7) |
| 洪水 | 平均值(4) |
*風險可能並不涉及整個地區,尤其是洪水或山體滑坡。
Sources: 1. Dilley, M., R.S. Chen, U. Deichmann, A.L. Lerner-Lam, M. Arnold, J. Agwe, P. Buys, O. Kjekstad, B. Lyon, and G. Yetman. 2005. Natural Disaster Hotspots: A Global Risk Analysis. Washington, D.C.: World Bank. https://doi.org/10.1596/0-8213-5930-4.
2. Center for Hazards and Risk Research - CHRR - Columbia University, Center for International Earth Science Information Network - CIESIN - Columbia University, International Bank for Reconstruction and Development - The World Bank, and United Nations Environment Programme Global Resource Information Database Geneva - UNEP/GRID-Geneva. 2005. Global Cyclone Hazard Frequency and Distribution. Palisades, NY: NASA Socioeconomic Data and Applications Center (SEDAC). https://doi.org/10.7927/H4CZ353K.
3. Center for Hazards and Risk Research - CHRR - Columbia University, Center for International Earth Science Information Network - CIESIN - Columbia University. 2005. Global Flood Hazard Frequency and Distribution. Palisades, NY: NASA Socioeconomic Data and Applications Center (SEDAC). https://doi.org/10.7927/H4668B3D.
最近的附近地震
幅度3.0以上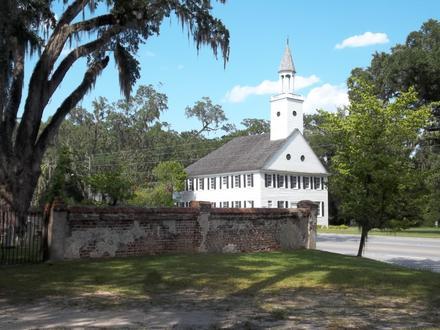

關於我們的數據
此頁面上的數據是使用許多公共可用工具和資源估算的。它不提供任何保修,並且可能包含不正確的地方。使用風險自負。有關更多信息,請參見此處 。