- 世界
- »
- US
- »
- 紐約州
- »
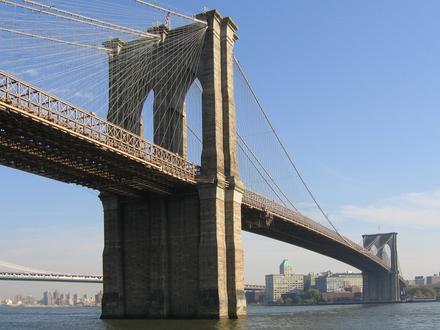
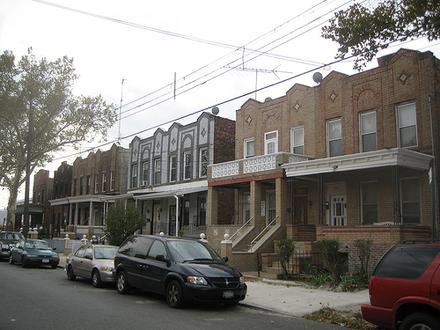
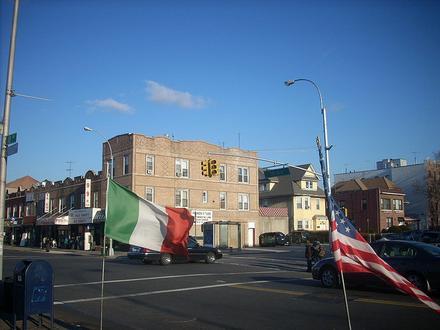
- Flatlands, 紐約州
在Flatlands的企業
| Flatlands, 紐約州地區 | 1.664 平方英里 |
| 人口 | 56925 |
| 男性人口 | 25686 (45.1%) |
| 女性人口 | 31239 (54.9%) |
| 從1975到2015的人口變化 | +24.1% |
| 從2000到2015的人口變化 | +0.8% |
| 年齡中位數 | 36.7 |
| 男性平均年齡 | 34.1 |
| 女性平均年齡 | 38.8 |
| 鄰近社區 | Flatlands, Georgetown, Marine Park, Midwood |
| 當地時間 | 星期日 02:04 |
| 時區 | 北美东部夏令时间 |
| 經度與緯度 | 40.62122° / -73.93486° |
| 郵編 | 11210 |
Flatlands, 紐約州 -地圖
Flatlands, 紐約州人口
1975年到2015年| 數據 | 1975 | 1990 | 2000 | 2015 |
|---|---|---|---|---|
| 人口 | 45879 | 54302 | 56461 | 56925 |
| 人口密度 | 27579 / mi² | 32643 / mi² | 33941 / mi² | 34219 / mi² |
Flatlands從2000到2015的人口變化
從2000年到2015年增長0.8%| 位置 | 1975以來的變化 | 1990以來的變化 | 2000以來的變化 |
|---|---|---|---|
| Flatlands, 紐約州 | +24.1% | +4.8% | +0.8% |
| New York | +16.9% | +3.3% | +1.6% |
| 紐約州 | +15.2% | +7.1% | +1.6% |
| United States | +46.9% | +27.2% | +13.7% |
Flatlands, 紐約州平均年齡
平均年齡:36.7 年| 位置 | 年齡中位數 | 中位年齡(女) | 中位年齡(男) |
|---|---|---|---|
| Flatlands, 紐約州 | 36.7 年 | 38.8 年 | 34.1 年 |
| New York | 35.5 年 | 36.8 年 | 34.1 年 |
| 紐約州 | 38.1 年 | 39.6 年 | 36.6 年 |
| United States | 37.4 年 | 38.7 年 | 36.1 年 |
Flatlands, 紐約州人口樹狀圖
年齡和性別的人口| 年齡 | 男性 | 女性 | 總 |
|---|---|---|---|
| 5歲以下 | 1776 | 1807 | 3584 |
| 5-9 | 1768 | 1815 | 3583 |
| 10-14 | 1872 | 1892 | 3765 |
| 15-19 | 2061 | 2172 | 4234 |
| 20-24 | 2086 | 2157 | 4244 |
| 25-29 | 1914 | 2129 | 4043 |
| 30-34 | 1664 | 2065 | 3730 |
| 35-39 | 1654 | 2102 | 3757 |
| 40-44 | 1677 | 2060 | 3738 |
| 45-49 | 1765 | 2331 | 4096 |
| 50-54 | 1849 | 2531 | 4381 |
| 55-59 | 1673 | 2204 | 3877 |
| 60-64 | 1401 | 1864 | 3265 |
| 65-69 | 942 | 1301 | 2244 |
| 70-74 | 664 | 953 | 1617 |
| 75-79 | 410 | 698 | 1109 |
| 80-84 | 262 | 575 | 837 |
| 85加 | 247 | 581 | 828 |
Flatlands, 紐約州人口密度
人口密度: 34219 / mi²| 位置 | 人口 | 區 | 人口密度 |
|---|---|---|---|
| Flatlands, 紐約州 | 56925 | 1.664 平方英里 | 34219 / mi² |
| New York | 8.1 million | 302.8 平方英里 | 26812 / mi² |
| 紐約州 | 19.4 million | 54,555.3 平方英里 | 355.2 / mi² |
| United States | 321.6 million | 3,796,761.2 平方英里 | 84.7 / mi² |
Flatlands, 紐約州的歷史和預計人口
從1840到2100的估計人口Sources:
1. JRC (European Commission's Joint Research Centre) work on the GHS built-up grid
2. CIESIN (Center for International Earth Science Information Network)
3. [鏈接] Klein Goldewijk, K., Beusen, A., Doelman, J., and Stehfest, E.: Anthropogenic land use estimates for the Holocene – HYDE 3.2, Earth Syst. Sci. Data, 9, 927–953, https://doi.org/10.5194/essd-9-927-2017, 2017.
鄰近社區
Flatlands企業(按街區分佈) Flatlands: 42.3%
Georgetown: 19.2%
Marine Park: 19.2%
Midwood: 11.5%
Mill Basin: 7.7%
區號
Flatlands的企業使用的區碼百分比 電話區號 718: 72.7%
電話區號 347: 18.2%
電話區號 917: 9.1%
人類發展指數(HDI)
預期壽命,教育程度和人均收入的統計綜合指數。Sources: [Link] Kummu, M., Taka, M. & Guillaume, J. Gridded global datasets for Gross Domestic Product and Human Development Index over 1990–2015. Sci Data 5, 180004 (2018) doi:10.1038/sdata.2018.4
Flatlands, 紐約州二氧化碳排放
每年人均二氧化碳(CO2)排放量(噸)| 位置 | 二氧化碳排放量 | 人均二氧化碳排放量 | 二氧化碳排放強度 |
|---|---|---|---|
| Flatlands, 紐約州 | 734,291 美噸 | 12.9 美噸 | 441,412 tn/mi² |
| New York | 104,210,564 美噸 | 12.8 美噸 | 344,120 tn/mi² |
| 紐約州 | 334,299,374 美噸 | 17.3 美噸 | 6,127 tn/mi² |
| United States | 5,664,619,809 美噸 | 17.6 美噸 | 1,491 tn/mi² |
Flatlands, 紐約州二氧化碳排放
| 2013年二氧化碳排放量(噸/年) | 734,291 美噸 |
| 2013人均二氧化碳排放量(噸/年) | 12.9 美噸 |
| 2013二氧化碳排放強度(噸/平方英里/年) |
自然災害風險
相對風險(滿分10分)| 氣旋 | 高(8) |
| 洪水 | 平均值(4) |
| 地震 | 低 (2) |
*風險可能並不涉及整個地區,尤其是洪水或山體滑坡。
Sources: 1. Dilley, M., R.S. Chen, U. Deichmann, A.L. Lerner-Lam, M. Arnold, J. Agwe, P. Buys, O. Kjekstad, B. Lyon, and G. Yetman. 2005. Natural Disaster Hotspots: A Global Risk Analysis. Washington, D.C.: World Bank. https://doi.org/10.1596/0-8213-5930-4.
2. Center for Hazards and Risk Research - CHRR - Columbia University, Center for International Earth Science Information Network - CIESIN - Columbia University. 2005. Global Earthquake Hazard Distribution - Peak Ground Acceleration. Palisades, NY: NASA Socioeconomic Data and Applications Center (SEDAC). https://doi.org/10.7927/H4BZ63ZS.
3. Center for Hazards and Risk Research - CHRR - Columbia University, Center for International Earth Science Information Network - CIESIN - Columbia University, International Bank for Reconstruction and Development - The World Bank, and United Nations Environment Programme Global Resource Information Database Geneva - UNEP/GRID-Geneva. 2005. Global Cyclone Hazard Frequency and Distribution. Palisades, NY: NASA Socioeconomic Data and Applications Center (SEDAC). https://doi.org/10.7927/H4CZ353K.
4. Center for Hazards and Risk Research - CHRR - Columbia University, Center for International Earth Science Information Network - CIESIN - Columbia University. 2005. Global Flood Hazard Frequency and Distribution. Palisades, NY: NASA Socioeconomic Data and Applications Center (SEDAC). https://doi.org/10.7927/H4668B3D.
最近的附近地震
幅度3.0以上| 日 | 時間 | 大小 | 距離 | 深度 | 位置 | 鏈接 |
|---|---|---|---|---|---|---|
| 2003/8/26 | 上午11:24 | 3.1 | 99.1 公里 | 2,910 公尺 | New Jersey | usgs.gov |
| 1992/1/9 | 凌晨12:50 | 3.1 | 44.8 公里 | 7,900 公尺 | New Jersey | usgs.gov |
| 1985/10/19 | 凌晨3:07 | 3.6 | 40.8 公里 | 6,000 公尺 | New York | usgs.gov |
| 1979/3/9 | 晚上8:49 | 3.1 | 49.4 公里 | 3,000 公尺 | New Jersey | usgs.gov |
| 1979/1/30 | 上午8:30 | 3.5 | 43.5 公里 | 5,000 公尺 | New Jersey | usgs.gov |
| 1976/4/13 | 清晨7:39 | 3.1 | 21.4 公里 | None | Greater New York area, New Jersey | usgs.gov |
| 1957/3/23 | 上午11:02 | 3.8 | 73.3 公里 | 10,000 公尺 | New Jersey | usgs.gov |
| 1895/9/1 | 凌晨3:09 | 4.1 | 49.9 公里 | None | New Jersey | usgs.gov |
| 1884/8/10 | 上午11:07 | 5.5 | 6 公里 | None | New York | usgs.gov |
| 1783/11/29 | 晚上7:57 | 5.3 | 63.6 公里 | None | New Jersey | usgs.gov |
查找Flatlands, 紐約州附近的歷史地震事件
最早日期 最新日期
幅度3.0以上 幅度4.0及更高 震級5.0以上
郵編
按郵編在Flatlands的企業百分比 郵編 11210: 45.8%
郵編 11234: 41.7%
郵編 11203: 8.3%
郵編 11212: 4.2%

關於我們的數據
此頁面上的數據是使用許多公共可用工具和資源估算的。它不提供任何保修,並且可能包含不正確的地方。使用風險自負。有關更多信息,請參見此處 。