- 世界
- »
- US
- »
- 新墨西哥州
- »
- Farmington, 新墨西哥州
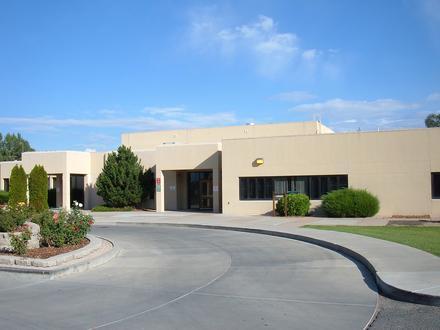
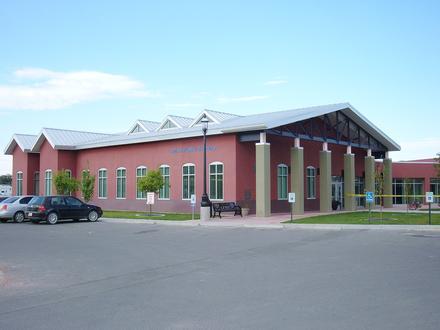
在Farmington的企業
產業領域
行業分佈 購物中心: 16.7%
醫療: 13.8%
專業服務: 10.8%
行業: 10.4%
家庭服務: 8.2%
汽車: 7.8%
其他: 32.3%
| 行業說明 | 機構數 | 平均營業年齡 | Google平均評分 | 每千名居民的業務 |
|---|---|---|---|---|
| 加油站 | 82 | 45.5 年 | 4.1 | 1.7 |
| 新車經銷商 | 57 | 36.5 年 | 4.3 | 1.2 |
| 汽車維修 | 189 | 36 年 | 4.1 | 3.9 |
| 汽車配件 | 95 | 39.8 年 | 4.1 | 2.0 |
| 发型师 | 70 | 31.3 年 | 4.0 | 1.4 |
| 美容院 | 75 | 29.9 年 | 4.2 | 1.6 |
| 公共行政 | 124 | 32.8 年 | 4.0 | 2.6 |
| 社會工作 | 96 | 32.8 年 | 3.9 | 2.0 |
| 借貸公司 | 140 | 38.7 年 | 4.2 | 2.9 |
| 資助其他 | 85 | 51.2 年 | 3.9 | 1.8 |
| 銀行 | 52 | 85.3 年 | 3.2 | 1.1 |
| 其他建築 | 83 | 33 年 | 4.3 | 1.7 |
| 房地產 | 153 | 33.2 年 | 4.0 | 3.2 |
| 總承包商 | 237 | 34.4 年 | 4.1 | 4.9 |
| 電氣安裝 | 49 | 32.7 年 | 4.1 | 1.0 |
| 其他成員組織 | 48 | 40.2 年 | 4.3 | 1.0 |
| 建築用品的批發 | 62 | 43.5 年 | 4.4 | 1.3 |
| 房屋建造 | 142 | 38.2 年 | 4.0 | 2.9 |
| 採礦 | 92 | 41.9 年 | 4.2 | 1.9 |
| 機械的批發 | 118 | 35.2 年 | 4.1 | 2.4 |
| 健康和醫療 | 775 | 29.4 年 | 4.3 | 16.0 |
| 內科醫生和外科醫生 | 250 | 31.8 年 | 4.0 | 5.2 |
| 牙醫 | 112 | 28.2 年 | 4.8 | 2.3 |
| 律師 | 87 | 32.2 年 | 4.1 | 1.8 |
| 技術建設服務 | 73 | 33.9 年 | 4.7 | 1.5 |
| 會計師 | 90 | 32.8 年 | 4.6 | 1.9 |
| 業務管理 | 70 | 27.4 年 | 4.2 | 1.4 |
| 科學和技術服務 | 80 | 31.2 年 | 4.4 | 1.7 |
| 教會 | 106 | 43.5 年 | 4.7 | 2.2 |
| 家用物品及設備 | 55 | 37.1 年 | 4.3 | 1.1 |
| 服裝店 | 82 | 34.3 年 | 4.0 | 1.7 |
| 硬件商店 | 83 | 43.6 年 | 4.3 | 1.7 |
| 購物-其他 | 91 | 40.5 年 | 4.0 | 1.9 |
| 電子商店 | 67 | 34.8 年 | 4.0 | 1.4 |
| Farmington, 新墨西哥州地區 | 32 平方英里 |
| 人口 | 48318 |
| 男性人口 | 23859 (49.4%) |
| 女性人口 | 24459 (50.6%) |
| 從1975到2015的人口變化 | +56.5% |
| 從2000到2015的人口變化 | +20.3% |
| 年齡中位數 | 32.7 |
| 男性平均年齡 | 31.8 |
| 女性平均年齡 | 33.6 |
| 電話區號 | 505 |
| 鄰近社區 | Farmington |
| 當地時間 | 星期四 09:11 |
| 時區 | 北美山区夏令时间 |
| 經度與緯度 | 36.72806° / -108.21869° |
| 郵編 | 87401, 87402 |
Farmington, 新墨西哥州 -地圖
Farmington, 新墨西哥州人口
1975年到2015年| 數據 | 1975 | 1990 | 2000 | 2015 |
|---|---|---|---|---|
| 人口 | 30872 | 35543 | 40172 | 48318 |
| 人口密度 | 964.7 / mi² | 1110 / mi² | 1255 / mi² | 1509 / mi² |
Farmington從2000到2015的人口變化
從2000年到2015年增長20.3%| 位置 | 1975以來的變化 | 1990以來的變化 | 2000以來的變化 |
|---|---|---|---|
| Farmington, 新墨西哥州 | +56.5% | +35.9% | +20.3% |
| 新墨西哥州 | +67.8% | +37.8% | +19% |
| United States | +46.9% | +27.2% | +13.7% |
Farmington, 新墨西哥州平均年齡
平均年齡:32.7 年| 位置 | 年齡中位數 | 中位年齡(女) | 中位年齡(男) |
|---|---|---|---|
| Farmington, 新墨西哥州 | 32.7 年 | 33.6 年 | 31.8 年 |
| 新墨西哥州 | 36.7 年 | 37.9 年 | 35.4 年 |
| United States | 37.4 年 | 38.7 年 | 36.1 年 |
Farmington, 新墨西哥州人口樹狀圖
年齡和性別的人口| 年齡 | 男性 | 女性 | 總 |
|---|---|---|---|
| 5歲以下 | 2090 | 2080 | 4171 |
| 5-9 | 1892 | 1889 | 3781 |
| 10-14 | 1660 | 1696 | 3357 |
| 15-19 | 1774 | 1754 | 3528 |
| 20-24 | 1803 | 1712 | 3516 |
| 25-29 | 2086 | 1929 | 4015 |
| 30-34 | 1730 | 1635 | 3366 |
| 35-39 | 1492 | 1437 | 2929 |
| 40-44 | 1384 | 1345 | 2730 |
| 45-49 | 1508 | 1585 | 3094 |
| 50-54 | 1671 | 1660 | 3331 |
| 55-59 | 1461 | 1508 | 2970 |
| 60-64 | 1096 | 1200 | 2296 |
| 65-69 | 673 | 813 | 1487 |
| 70-74 | 489 | 663 | 1152 |
| 75-79 | 449 | 615 | 1064 |
| 80-84 | 340 | 445 | 786 |
| 85加 | 261 | 493 | 755 |
Farmington, 新墨西哥州人口密度
人口密度: 1509 / mi²| 位置 | 人口 | 區 | 人口密度 |
|---|---|---|---|
| Farmington, 新墨西哥州 | 48318 | 32 平方英里 | 1509 / mi² |
| 新墨西哥州 | 2.2 million | 121,591.1 平方英里 | 17.9 / mi² |
| United States | 321.6 million | 3,796,761.2 平方英里 | 84.7 / mi² |
Farmington, 新墨西哥州的歷史和預計人口
從1830到2100的估計人口Sources:
1. JRC (European Commission's Joint Research Centre) work on the GHS built-up grid
2. CIESIN (Center for International Earth Science Information Network)
3. [鏈接] Klein Goldewijk, K., Beusen, A., Doelman, J., and Stehfest, E.: Anthropogenic land use estimates for the Holocene – HYDE 3.2, Earth Syst. Sci. Data, 9, 927–953, https://doi.org/10.5194/essd-9-927-2017, 2017.
Farmington, 新墨西哥州企業(按價格分佈)
便宜: 46.4%
中等: 43.3%
昂貴: 7.7%
非常昂貴: 2.6%
人類發展指數(HDI)
預期壽命,教育程度和人均收入的統計綜合指數。Sources: [Link] Kummu, M., Taka, M. & Guillaume, J. Gridded global datasets for Gross Domestic Product and Human Development Index over 1990–2015. Sci Data 5, 180004 (2018) doi:10.1038/sdata.2018.4
Farmington, 新墨西哥州二氧化碳排放
每年人均二氧化碳(CO2)排放量(噸)| 位置 | 二氧化碳排放量 | 人均二氧化碳排放量 | 二氧化碳排放強度 |
|---|---|---|---|
| Farmington, 新墨西哥州 | 761,032 美噸 | 15.8 美噸 | 23,782 tn/mi² |
| 新墨西哥州 | 37,040,392 美噸 | 17 美噸 | 304.6 tn/mi² |
| United States | 5,664,619,809 美噸 | 17.6 美噸 | 1,491 tn/mi² |
Farmington, 新墨西哥州二氧化碳排放
| 2013年二氧化碳排放量(噸/年) | 761,032 美噸 |
| 2013人均二氧化碳排放量(噸/年) | 15.8 美噸 |
| 2013二氧化碳排放強度(噸/平方英里/年) |
自然災害風險
相對風險(滿分10分)| 乾旱 | 高(10) |
*風險可能並不涉及整個地區,尤其是洪水或山體滑坡。
Sources: 1. Dilley, M., R.S. Chen, U. Deichmann, A.L. Lerner-Lam, M. Arnold, J. Agwe, P. Buys, O. Kjekstad, B. Lyon, and G. Yetman. 2005. Natural Disaster Hotspots: A Global Risk Analysis. Washington, D.C.: World Bank. https://doi.org/10.1596/0-8213-5930-4.
2. Center for Hazards and Risk Research - CHRR - Columbia University, Center for International Earth Science Information Network - CIESIN - Columbia University, and International Research Institute for Climate and Society - IRI - Columbia University. 2005. Global Drought Hazard Frequency and Distribution. Palisades, NY: NASA Socioeconomic Data and Applications Center (SEDAC). https://doi.org/10.7927/H4VX0DFT.
最近的附近地震
幅度3.0以上郵編
按郵編在Farmington的企業百分比 郵編 87401: 77.4%
郵編 87402: 20.8%
其他: 1.7%

關於我們的數據
此頁面上的數據是使用許多公共可用工具和資源估算的。它不提供任何保修,並且可能包含不正確的地方。使用風險自負。有關更多信息,請參見此處 。