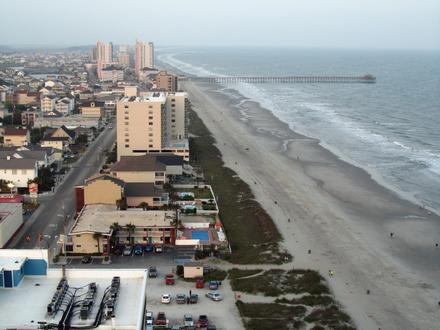
在Calabash的企業
產業領域
行業分佈 購物中心: 23.5%
家庭服務: 11.9%
餐廳: 11.2%
專業服務: 8.2%
行業: 8%
醫療: 5.3%
其他: 31.8%
| 行業說明 | 機構數 | 平均營業年齡 | Google平均評分 | 每千名居民的業務 |
|---|---|---|---|---|
| 加油站 | 5 | 4.2 | 2.5 | |
| 汽車維修 | 8 | 4.3 | 4.0 | |
| 发型师 | 10 | 25.1 年 | 4.2 | 5.0 |
| 美容院 | 9 | 24.7 年 | 4.5 | 4.5 |
| 銀行 | 7 | 3.5 | 3.5 | |
| 非同步傳輸模式 | 7 | 3.5 | 3.5 | |
| 雜貨店和超市 | 5 | 4.4 | 2.5 | |
| 麵包店 | 6 | 4.8 | 3.0 | |
| 住房建設 | 7 | 3.5 | ||
| 園林綠化 | 7 | 22.5 年 | 4.2 | 3.5 |
| 房地產 | 27 | 29.9 年 | 4.3 | 13.5 |
| 總承包商 | 22 | 33.2 年 | 4.4 | 11.0 |
| 其他住宿 | 6 | 82.9 年 | 3.9 | 3.0 |
| 其他成員組織 | 5 | 4.5 | 2.5 | |
| 房屋建造 | 14 | 39.4 年 | 3.4 | 7.0 |
| 健康和醫療 | 11 | 4.3 | 5.5 | |
| 內科醫生和外科醫生 | 6 | 4.0 | 3.0 | |
| 科學和技術服務 | 5 | 4.2 | 2.5 | |
| 教會 | 8 | 39.3 年 | 5.0 | 4.0 |
| 海鮮餐廳 | 11 | 86.3 年 | 4.3 | 5.5 |
| 美國餐館 | 5 | 4.4 | 2.5 | |
| 二手店 | 9 | 28.7 年 | 4.3 | 4.5 |
| 傢俱店 | 6 | 4.6 | 3.0 | |
| 家用物品及設備 | 6 | 4.6 | 3.0 | |
| 服裝店 | 7 | 22.5 年 | 5.0 | 3.5 |
| 購物-其他 | 9 | 45.4 年 | 4.5 | 4.5 |
| 高爾夫球場 | 9 | 72.7 年 | 4.1 | 4.5 |
| Calabash, North Carolina地區 | 3.668 平方英里 |
| 人口 | 2006 |
| 男性人口 | 1011 (50.4%) |
| 女性人口 | 995 (49.6%) |
| 從1975到2015的人口變化 | +69.3% |
| 從2000到2015的人口變化 | +75.5% |
| 年齡中位數 | 51.6 |
| 男性平均年齡 | 49.3 |
| 女性平均年齡 | 53.9 |
| 電話區號 | 910 |
| 鄰近社區 | Calabash |
| 當地時間 | 星期一 07:56 |
| 時區 | 北美东部夏令时间 |
| 經度與緯度 | 33.89073° / -78.56834° |
| 郵編 | 28467 |
Calabash, North Carolina -地圖
Calabash, North Carolina人口
1975年到2015年| 數據 | 1975 | 1990 | 2000 | 2015 |
|---|---|---|---|---|
| 人口 | 1185 | 1105 | 1143 | 2006 |
| 人口密度 | 323.1 / mi² | 301.3 / mi² | 311.6 / mi² | 546.9 / mi² |
Calabash從2000到2015的人口變化
從2000年到2015年增長75.5%| 位置 | 1975以來的變化 | 1990以來的變化 | 2000以來的變化 |
|---|---|---|---|
| Calabash, North Carolina | +69.3% | +81.5% | +75.5% |
| 北卡羅萊納州 | +99.6% | +54.2% | +27.7% |
| United States | +46.9% | +27.2% | +13.7% |
Calabash, North Carolina平均年齡
平均年齡:51.6 年| 位置 | 年齡中位數 | 中位年齡(女) | 中位年齡(男) |
|---|---|---|---|
| Calabash, North Carolina | 51.6 年 | 53.9 年 | 49.3 年 |
| 北卡羅萊納州 | 37.5 年 | 38.8 年 | 36.1 年 |
| United States | 37.4 年 | 38.7 年 | 36.1 年 |
Calabash, North Carolina人口樹狀圖
年齡和性別的人口| 年齡 | 男性 | 女性 | 總 |
|---|---|---|---|
| 5歲以下 | 51 | 47 | 98 |
| 5-9 | 42 | 32 | 74 |
| 10-14 | 40 | 44 | 85 |
| 15-19 | 52 | 35 | 87 |
| 20-24 | 60 | 49 | 109 |
| 25-29 | 35 | 44 | 80 |
| 30-34 | 59 | 45 | 104 |
| 35-39 | 49 | 44 | 94 |
| 40-44 | 56 | 42 | 99 |
| 45-49 | 70 | 59 | 130 |
| 50-54 | 65 | 73 | 139 |
| 55-59 | 59 | 82 | 142 |
| 60-64 | 80 | 81 | 162 |
| 65-69 | 85 | 89 | 175 |
| 70-74 | 78 | 78 | 157 |
| 75-79 | 54 | 62 | 117 |
| 80-84 | 42 | 51 | 93 |
| 85加 | 32 | 37 | 70 |
Calabash, North Carolina人口密度
人口密度: 546.9 / mi²| 位置 | 人口 | 區 | 人口密度 |
|---|---|---|---|
| Calabash, North Carolina | 2006 | 3.668 平方英里 | 546.9 / mi² |
| 北卡羅萊納州 | 10.3 million | 53,819.4 平方英里 | 191.9 / mi² |
| United States | 321.6 million | 3,796,761.2 平方英里 | 84.7 / mi² |
Calabash, North Carolina的預計人口
從1975到2100的估計人口Sources:
1. JRC (European Commission's Joint Research Centre) work on the GHS built-up grid
2. CIESIN (Center for International Earth Science Information Network)
3. [鏈接] Klein Goldewijk, K., Beusen, A., Doelman, J., and Stehfest, E.: Anthropogenic land use estimates for the Holocene – HYDE 3.2, Earth Syst. Sci. Data, 9, 927–953, https://doi.org/10.5194/essd-9-927-2017, 2017.
鄰近社區
Calabash企業(按街區分佈) Calabash: 90.5%
Sunset Beach: 4.8%
Carolina Shores: 4.8%
區號
Calabash的企業使用的區碼百分比 電話區號 910: 90.1%
電話區號 843: 6.2%
其他: 3.7%
Calabash, North Carolina企業(按價格分佈)
中等: 49.3%
便宜: 38.8%
昂貴: 11.9%
人類發展指數(HDI)
預期壽命,教育程度和人均收入的統計綜合指數。Sources: [Link] Kummu, M., Taka, M. & Guillaume, J. Gridded global datasets for Gross Domestic Product and Human Development Index over 1990–2015. Sci Data 5, 180004 (2018) doi:10.1038/sdata.2018.4
Calabash, North Carolina二氧化碳排放
每年人均二氧化碳(CO2)排放量(噸)| 位置 | 二氧化碳排放量 | 人均二氧化碳排放量 | 二氧化碳排放強度 |
|---|---|---|---|
| Calabash, North Carolina | 62,723 美噸 | 31.3 美噸 | 17,100 tn/mi² |
| 北卡羅萊納州 | 168,507,440 美噸 | 16.3 美噸 | 3,130 tn/mi² |
| United States | 5,664,619,809 美噸 | 17.6 美噸 | 1,491 tn/mi² |
Calabash, North Carolina二氧化碳排放
| 2013年二氧化碳排放量(噸/年) | 62,723 美噸 |
| 2013人均二氧化碳排放量(噸/年) | 31.3 美噸 |
| 2013二氧化碳排放強度(噸/平方英里/年) |
自然災害風險
相對風險(滿分10分)| 氣旋 | 高(10) |
| 地震 | 低 (2) |
*風險可能並不涉及整個地區,尤其是洪水或山體滑坡。
Sources: 1. Dilley, M., R.S. Chen, U. Deichmann, A.L. Lerner-Lam, M. Arnold, J. Agwe, P. Buys, O. Kjekstad, B. Lyon, and G. Yetman. 2005. Natural Disaster Hotspots: A Global Risk Analysis. Washington, D.C.: World Bank. https://doi.org/10.1596/0-8213-5930-4.
2. Center for Hazards and Risk Research - CHRR - Columbia University, Center for International Earth Science Information Network - CIESIN - Columbia University. 2005. Global Earthquake Hazard Distribution - Peak Ground Acceleration. Palisades, NY: NASA Socioeconomic Data and Applications Center (SEDAC). https://doi.org/10.7927/H4BZ63ZS.
3. Center for Hazards and Risk Research - CHRR - Columbia University, Center for International Earth Science Information Network - CIESIN - Columbia University, International Bank for Reconstruction and Development - The World Bank, and United Nations Environment Programme Global Resource Information Database Geneva - UNEP/GRID-Geneva. 2005. Global Cyclone Hazard Frequency and Distribution. Palisades, NY: NASA Socioeconomic Data and Applications Center (SEDAC). https://doi.org/10.7927/H4CZ353K.
關於我們的數據
此頁面上的數據是使用許多公共可用工具和資源估算的。它不提供任何保修,並且可能包含不正確的地方。使用風險自負。有關更多信息,請參見此處 。