- 世界
- »
- US
- »
- 奧克拉何馬州
- »
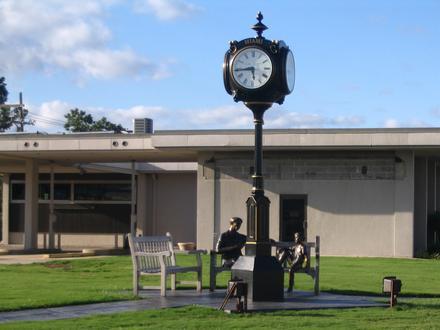
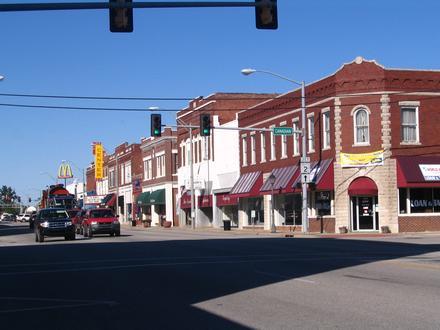
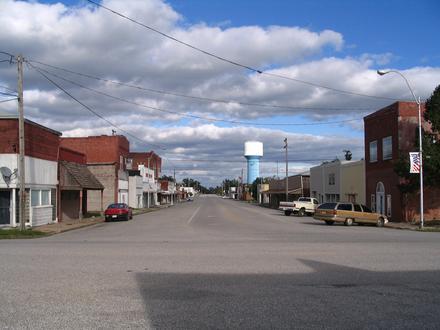
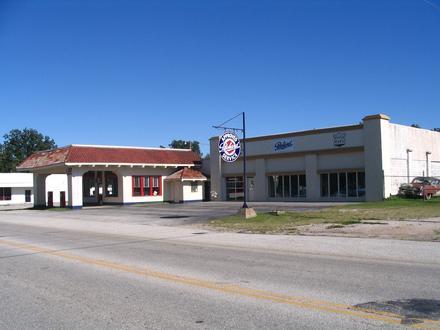
- Bluejacket, 奧克拉何馬州
在Bluejacket的企業
產業領域
行業分佈 行業: 15.1%
教育: 15.1%
醫療: 9.6%
家庭服務: 9.6%
宗教: 8.2%
購物中心: 8.2%
社區與政府: 8.2%
寵物: 6.8%
本機服務: 6.8%
專業服務: 5.5%
其他: 6.8%
| Bluejacket, 奧克拉何馬州地區 | 0.386 平方英里 |
| 人口 | 319 |
| 男性人口 | 146 (45.9%) |
| 女性人口 | 173 (54.1%) |
| 從1975到2015的人口變化 | +72.4% |
| 從2000到2015的人口變化 | -1.2% |
| 年齡中位數 | 49.7 |
| 男性平均年齡 | 42.8 |
| 女性平均年齡 | 55.5 |
| 電話區號 | 918 |
| 當地時間 | 星期四 18:01 |
| 時區 | 北美中部夏令时间 |
| 經度與緯度 | 36.7998° / -95.07108° |
| 郵編 | 74333 |
Bluejacket, 奧克拉何馬州 -地圖
Bluejacket, 奧克拉何馬州人口
1975年到2015年| 數據 | 1975 | 1990 | 2000 | 2015 |
|---|---|---|---|---|
| 人口 | 185 | 272 | 323 | 319 |
| 人口密度 | 479.1 / mi² | 704.5 / mi² | 836.6 / mi² | 826.2 / mi² |
Bluejacket從2000到2015的人口變化
從2000年到2015年下降1.2%| 位置 | 1975以來的變化 | 1990以來的變化 | 2000以來的變化 |
|---|---|---|---|
| Bluejacket, 奧克拉何馬州 | +72.4% | +17.3% | -1.2% |
| 奧克拉何馬州 | +45.5% | +24.9% | +11.9% |
| United States | +46.9% | +27.2% | +13.7% |
Bluejacket, 奧克拉何馬州平均年齡
平均年齡:49.7 年| 位置 | 年齡中位數 | 中位年齡(女) | 中位年齡(男) |
|---|---|---|---|
| Bluejacket, 奧克拉何馬州 | 49.7 年 | 55.5 年 | 42.8 年 |
| 奧克拉何馬州 | 36.5 年 | 37.8 年 | 35.1 年 |
| United States | 37.4 年 | 38.7 年 | 36.1 年 |
Bluejacket, 奧克拉何馬州人口樹狀圖
年齡和性別的人口| 年齡 | 男性 | 女性 | 總 |
|---|---|---|---|
| 5歲以下 | 5 | 9 | 15 |
| 5-9 | 12 | 7 | 20 |
| 10-14 | 10 | 6 | 17 |
| 15-19 | 8 | 7 | 15 |
| 20-24 | 5 | 9 | 14 |
| 25-29 | 9 | 4 | 13 |
| 30-34 | 11 | 7 | 18 |
| 35-39 | 9 | 2 | 11 |
| 40-44 | 8 | 10 | 18 |
| 45-49 | 5 | 12 | 18 |
| 50-54 | 12 | 11 | 23 |
| 55-59 | 13 | 27 | 41 |
| 60-64 | 15 | 17 | 32 |
| 65-69 | 8 | 19 | 27 |
| 70-74 | 3 | 12 | 16 |
| 75-79 | 8 | 0 | 9 |
| 80-84 | 3 | 5 | 8 |
| 85加 | 2 | 9 | 12 |
Bluejacket, 奧克拉何馬州人口密度
人口密度: 826.2 / mi²| 位置 | 人口 | 區 | 人口密度 |
|---|---|---|---|
| Bluejacket, 奧克拉何馬州 | 319 | 0.386 平方英里 | 826.2 / mi² |
| 奧克拉何馬州 | 3.9 million | 69,899.3 平方英里 | 55.5 / mi² |
| United States | 321.6 million | 3,796,761.2 平方英里 | 84.7 / mi² |
Bluejacket, 奧克拉何馬州歷史人口
從1730到2015的估計人口Sources:
1. JRC (European Commission's Joint Research Centre) work on the GHS built-up grid
2. CIESIN (Center for International Earth Science Information Network)
3. [鏈接] Klein Goldewijk, K., Beusen, A., Doelman, J., and Stehfest, E.: Anthropogenic land use estimates for the Holocene – HYDE 3.2, Earth Syst. Sci. Data, 9, 927–953, https://doi.org/10.5194/essd-9-927-2017, 2017.
人類發展指數(HDI)
預期壽命,教育程度和人均收入的統計綜合指數。Sources: [Link] Kummu, M., Taka, M. & Guillaume, J. Gridded global datasets for Gross Domestic Product and Human Development Index over 1990–2015. Sci Data 5, 180004 (2018) doi:10.1038/sdata.2018.4
Bluejacket, 奧克拉何馬州二氧化碳排放
每年人均二氧化碳(CO2)排放量(噸)| 位置 | 二氧化碳排放量 | 人均二氧化碳排放量 | 二氧化碳排放強度 |
|---|---|---|---|
| Bluejacket, 奧克拉何馬州 | 5,929 美噸 | 18.6 美噸 | 15,357 tn/mi² |
| 奧克拉何馬州 | 77,786,423 美噸 | 20 美噸 | 1,112 tn/mi² |
| United States | 5,664,619,809 美噸 | 17.6 美噸 | 1,491 tn/mi² |
Bluejacket, 奧克拉何馬州二氧化碳排放
| 2013年二氧化碳排放量(噸/年) | 5,929 美噸 |
| 2013人均二氧化碳排放量(噸/年) | 18.6 美噸 |
| 2013二氧化碳排放強度(噸/平方英里/年) |
自然災害風險
相對風險(滿分10分)| 洪水 | 高(9) |
*風險可能並不涉及整個地區,尤其是洪水或山體滑坡。
Sources: 1. Dilley, M., R.S. Chen, U. Deichmann, A.L. Lerner-Lam, M. Arnold, J. Agwe, P. Buys, O. Kjekstad, B. Lyon, and G. Yetman. 2005. Natural Disaster Hotspots: A Global Risk Analysis. Washington, D.C.: World Bank. https://doi.org/10.1596/0-8213-5930-4.
2. Center for Hazards and Risk Research - CHRR - Columbia University, Center for International Earth Science Information Network - CIESIN - Columbia University. 2005. Global Flood Hazard Frequency and Distribution. Palisades, NY: NASA Socioeconomic Data and Applications Center (SEDAC). https://doi.org/10.7927/H4668B3D.
最近的附近地震
幅度3.0以上| 日 | 時間 | 大小 | 距離 | 深度 | 位置 | 鏈接 |
|---|---|---|---|---|---|---|
| 1956/10/30 | 凌晨2:36 | 4 | 93.2 公里 | None | Oklahoma | usgs.gov |
關於我們的數據
此頁面上的數據是使用許多公共可用工具和資源估算的。它不提供任何保修,並且可能包含不正確的地方。使用風險自負。有關更多信息,請參見此處 。