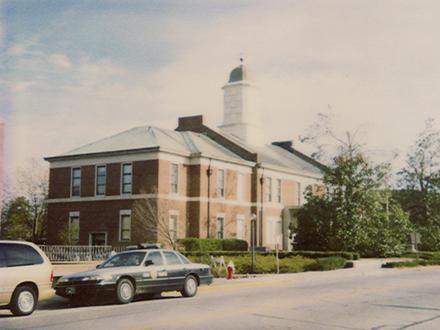
在Beulaville的企業
產業領域
行業分佈 購物中心: 22.2%
家庭服務: 9%
行業: 8.5%
醫療: 7.7%
汽車: 7.7%
專業服務: 7.1%
宗教: 6.8%
餐廳: 6.1%
其他: 24.9%
| 行業說明 | 機構數 | 平均營業年齡 | Google平均評分 | 每千名居民的業務 |
|---|---|---|---|---|
| 二手車經銷商 | 5 | 49.5 年 | 4.5 | 3.6 |
| 加油站 | 8 | 36.9 年 | 4.2 | 5.7 |
| 汽車維修 | 18 | 35.5 年 | 4.6 | 12.9 |
| 汽車配件 | 11 | 39.3 年 | 4.6 | 7.9 |
| 輪胎和電池 | 7 | 31.9 年 | 4.6 | 5.0 |
| 发型师 | 16 | 31.3 年 | 4.7 | 11.5 |
| 美容院 | 12 | 28.9 年 | 4.7 | 8.6 |
| 公共行政 | 6 | 1.0 | 4.3 | |
| 銀行 | 7 | 5.0 | 5.0 | |
| 非同步傳輸模式 | 7 | 5.0 | 5.0 | |
| 便利店 | 7 | 4.2 | 5.0 | |
| 雜貨店和超市 | 14 | 42.2 年 | 4.2 | 10.0 |
| 其他建築 | 5 | 4.4 | 3.6 | |
| 房地產 | 15 | 30.7 年 | 3.2 | 10.8 |
| 總承包商 | 12 | 36.4 年 | 3.6 | 8.6 |
| 電氣安裝 | 5 | 29.1 年 | 2.2 | 3.6 |
| 房屋建造 | 7 | 37.2 年 | 3.7 | 5.0 |
| 貨運/商業運輸 | 5 | 28.7 年 | 3.6 | |
| 健康和醫療 | 45 | 26 年 | 3.6 | 32.3 |
| 兒科醫生 | 5 | 3.3 | 3.6 | |
| 內科醫生和外科醫生 | 12 | 3.0 | 8.6 | |
| 會計師 | 9 | 36.1 年 | 5.0 | 6.5 |
| 教會 | 30 | 43.4 年 | 4.5 | 21.5 |
| 美國餐館 | 6 | 33.1 年 | 4.2 | 4.3 |
| 二手店 | 6 | 23 年 | 4.3 | |
| 傢俱店 | 5 | 3.6 | ||
| 家用物品及設備 | 9 | 32.3 年 | 5.0 | 6.5 |
| 禮品,卡片和聚會用品 | 6 | 25.1 年 | 4.6 | 4.3 |
| 花商 | 6 | 3.7 | 4.3 | |
| 藥房和藥店 | 12 | 4.5 | 8.6 | |
| 購物-其他 | 6 | 25.7 年 | 4.3 |
| Beulaville, North Carolina地區 | 1.506 平方英里 |
| 人口 | 1394 |
| 男性人口 | 601 (43.1%) |
| 女性人口 | 793 (56.9%) |
| 從1975到2015的人口變化 | +145% |
| 從2000到2015的人口變化 | +27.7% |
| 年齡中位數 | 44 |
| 男性平均年齡 | 42.4 |
| 女性平均年齡 | 45.2 |
| 電話區號 | 910 |
| 鄰近社區 | Beulaville |
| 當地時間 | 星期一 07:56 |
| 時區 | 北美东部夏令时间 |
| 經度與緯度 | 34.92378° / -77.77387° |
| 郵編 | 28518 |
Beulaville, North Carolina -地圖
Beulaville, North Carolina人口
1975年到2015年| 數據 | 1975 | 1990 | 2000 | 2015 |
|---|---|---|---|---|
| 人口 | 569 | 902 | 1092 | 1394 |
| 人口密度 | 377.9 / mi² | 599.0 / mi² | 725.2 / mi² | 925.8 / mi² |
Beulaville從2000到2015的人口變化
從2000年到2015年增長27.7%| 位置 | 1975以來的變化 | 1990以來的變化 | 2000以來的變化 |
|---|---|---|---|
| Beulaville, North Carolina | +145% | +54.5% | +27.7% |
| 北卡羅萊納州 | +99.6% | +54.2% | +27.7% |
| United States | +46.9% | +27.2% | +13.7% |
Beulaville, North Carolina平均年齡
平均年齡:44 年| 位置 | 年齡中位數 | 中位年齡(女) | 中位年齡(男) |
|---|---|---|---|
| Beulaville, North Carolina | 44 年 | 45.2 年 | 42.4 年 |
| 北卡羅萊納州 | 37.5 年 | 38.8 年 | 36.1 年 |
| United States | 37.4 年 | 38.7 年 | 36.1 年 |
Beulaville, North Carolina人口樹狀圖
年齡和性別的人口| 年齡 | 男性 | 女性 | 總 |
|---|---|---|---|
| 5歲以下 | 40 | 46 | 87 |
| 5-9 | 41 | 41 | 82 |
| 10-14 | 48 | 43 | 92 |
| 15-19 | 32 | 40 | 72 |
| 20-24 | 34 | 50 | 85 |
| 25-29 | 31 | 42 | 73 |
| 30-34 | 27 | 46 | 74 |
| 35-39 | 29 | 37 | 67 |
| 40-44 | 39 | 48 | 88 |
| 45-49 | 54 | 58 | 113 |
| 50-54 | 41 | 50 | 91 |
| 55-59 | 55 | 40 | 95 |
| 60-64 | 37 | 39 | 77 |
| 65-69 | 23 | 47 | 71 |
| 70-74 | 23 | 55 | 78 |
| 75-79 | 25 | 47 | 73 |
| 80-84 | 17 | 36 | 53 |
| 85加 | 5 | 26 | 32 |
Beulaville, North Carolina人口密度
人口密度: 925.8 / mi²| 位置 | 人口 | 區 | 人口密度 |
|---|---|---|---|
| Beulaville, North Carolina | 1394 | 1.506 平方英里 | 925.8 / mi² |
| 北卡羅萊納州 | 10.3 million | 53,819.4 平方英里 | 191.9 / mi² |
| United States | 321.6 million | 3,796,761.2 平方英里 | 84.7 / mi² |
Beulaville, North Carolina的歷史和預計人口
從1760到2100的估計人口Sources:
1. JRC (European Commission's Joint Research Centre) work on the GHS built-up grid
2. CIESIN (Center for International Earth Science Information Network)
3. [鏈接] Klein Goldewijk, K., Beusen, A., Doelman, J., and Stehfest, E.: Anthropogenic land use estimates for the Holocene – HYDE 3.2, Earth Syst. Sci. Data, 9, 927–953, https://doi.org/10.5194/essd-9-927-2017, 2017.
Beulaville, North Carolina企業(按價格分佈)
便宜: 63.6%
中等: 34.1%
非常昂貴: 2.3%
人類發展指數(HDI)
預期壽命,教育程度和人均收入的統計綜合指數。Sources: [Link] Kummu, M., Taka, M. & Guillaume, J. Gridded global datasets for Gross Domestic Product and Human Development Index over 1990–2015. Sci Data 5, 180004 (2018) doi:10.1038/sdata.2018.4
Beulaville, North Carolina二氧化碳排放
每年人均二氧化碳(CO2)排放量(噸)| 位置 | 二氧化碳排放量 | 人均二氧化碳排放量 | 二氧化碳排放強度 |
|---|---|---|---|
| Beulaville, North Carolina | 23,333 美噸 | 16.7 美噸 | 15,495 tn/mi² |
| 北卡羅萊納州 | 168,507,440 美噸 | 16.3 美噸 | 3,130 tn/mi² |
| United States | 5,664,619,809 美噸 | 17.6 美噸 | 1,491 tn/mi² |
Beulaville, North Carolina二氧化碳排放
| 2013年二氧化碳排放量(噸/年) | 23,333 美噸 |
| 2013人均二氧化碳排放量(噸/年) | 16.7 美噸 |
| 2013二氧化碳排放強度(噸/平方英里/年) |
自然災害風險
相對風險(滿分10分)| 氣旋 | 高(9) |
*風險可能並不涉及整個地區,尤其是洪水或山體滑坡。
Sources: 1. Dilley, M., R.S. Chen, U. Deichmann, A.L. Lerner-Lam, M. Arnold, J. Agwe, P. Buys, O. Kjekstad, B. Lyon, and G. Yetman. 2005. Natural Disaster Hotspots: A Global Risk Analysis. Washington, D.C.: World Bank. https://doi.org/10.1596/0-8213-5930-4.
2. Center for Hazards and Risk Research - CHRR - Columbia University, Center for International Earth Science Information Network - CIESIN - Columbia University, International Bank for Reconstruction and Development - The World Bank, and United Nations Environment Programme Global Resource Information Database Geneva - UNEP/GRID-Geneva. 2005. Global Cyclone Hazard Frequency and Distribution. Palisades, NY: NASA Socioeconomic Data and Applications Center (SEDAC). https://doi.org/10.7927/H4CZ353K.
最近的附近地震
幅度3.0以上| 日 | 時間 | 大小 | 距離 | 深度 | 位置 | 鏈接 |
|---|---|---|---|---|---|---|
| 1994/8/6 | 中午12:54 | 3.8 | 94.7 公里 | 5,000 公尺 | North Carolina | usgs.gov |
關於我們的數據
此頁面上的數據是使用許多公共可用工具和資源估算的。它不提供任何保修,並且可能包含不正確的地方。使用風險自負。有關更多信息,請參見此處 。