- 世界
- »
- US
- »
- 麻省
- »
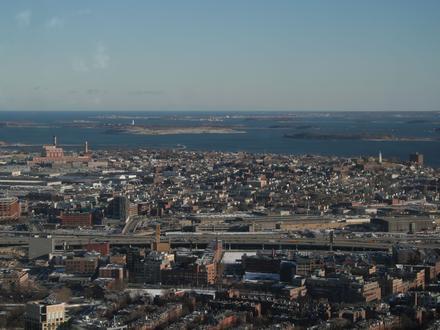
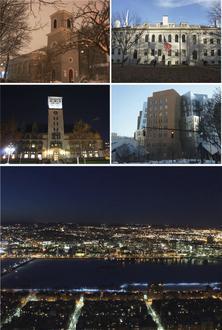
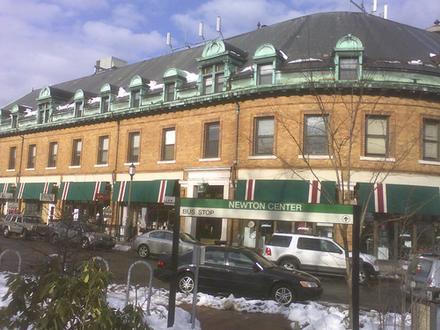
- Belmont, 麻省
在Belmont的企業
產業領域
行業分佈 醫療: 25.8%
專業服務: 13.6%
購物中心: 12.6%
家庭服務: 7.2%
本機服務: 5.3%
教育: 5.1%
其他: 30.4%
| 行業說明 | 機構數 | 平均營業年齡 | Google平均評分 | 每千名居民的業務 |
|---|---|---|---|---|
| 加油站 | 19 | 40.4 年 | 4.3 | 0.8 |
| 汽車維修 | 33 | 33.3 年 | 4.5 | 1.4 |
| 发型师 | 42 | 27.5 年 | 4.6 | 1.8 |
| 美容院 | 39 | 26.3 年 | 4.7 | 1.6 |
| 社會工作 | 41 | 34.1 年 | 4.5 | 1.7 |
| 教育其他 | 26 | 30.4 年 | 4.9 | 1.1 |
| 借貸公司 | 22 | 28.3 年 | 4.3 | 0.9 |
| 資助其他 | 24 | 59.9 年 | 3.8 | 1.0 |
| 銀行 | 26 | 75.4 年 | 3.9 | 1.1 |
| 非同步傳輸模式 | 21 | 55.5 年 | 4.3 | 0.9 |
| 雜貨店和超市 | 23 | 26.9 年 | 4.3 | 1.0 |
| 其他建築 | 36 | 36.3 年 | 4.5 | 1.5 |
| 房地產 | 46 | 27.9 年 | 4.1 | 1.9 |
| 總承包商 | 41 | 32.9 年 | 4.5 | 1.7 |
| 其他成員組織 | 23 | 39 年 | 4.2 | 1.0 |
| 房屋建造 | 28 | 33.2 年 | 4.5 | 1.2 |
| 兒童護理及日間護理 | 20 | 32.9 年 | 4.9 | 0.8 |
| 健康和醫療 | 474 | 27.9 年 | 3.3 | 19.9 |
| 內科醫生和外科醫生 | 223 | 29.2 年 | 3.7 | 9.4 |
| 牙醫 | 57 | 30 年 | 4.8 | 2.4 |
| 精神科醫生和心理諮詢師 | 109 | 23.6 年 | 3.9 | 4.6 |
| 專業設計 | 21 | 21.1 年 | 5.0 | 0.9 |
| 律師 | 36 | 28.2 年 | 4.2 | 1.5 |
| 業務管理 | 61 | 26.1 年 | 4.5 | 2.6 |
| 科學和技術服務 | 41 | 24 年 | 3.4 | 1.7 |
| 教會 | 27 | 70.3 年 | 4.9 | 1.1 |
| 購物-其他 | 33 | 30.1 年 | 4.2 | 1.4 |
| 電子商店 | 39 | 28 年 | 4.0 | 1.6 |
| Belmont, 麻省地區 | 4.71 平方英里 |
| 人口 | 23849 |
| 男性人口 | 11247 (47.2%) |
| 女性人口 | 12602 (52.8%) |
| 從1975到2015的人口變化 | +27.6% |
| 從2000到2015的人口變化 | +2.3% |
| 年齡中位數 | 42.1 |
| 男性平均年齡 | 41.2 |
| 女性平均年齡 | 42.9 |
| 電話區號 | 617, 781, 857 |
| 鄰近社區 | Belmont Center, Belmont Hill, Cushing Square, East Watertown, Waverley Square, West End |
| 當地時間 | 星期一 00:18 |
| 時區 | 北美东部夏令时间 |
| 經度與緯度 | 42.39593° / -71.17867° |
| 郵編 | 02478, 02479 |
Belmont, 麻省 -地圖
Belmont, 麻省人口
1975年到2015年| 數據 | 1975 | 1990 | 2000 | 2015 |
|---|---|---|---|---|
| 人口 | 18685 | 21730 | 23316 | 23849 |
| 人口密度 | 3966 / mi² | 4613 / mi² | 4949 / mi² | 5062 / mi² |
Belmont從2000到2015的人口變化
從2000年到2015年增長2.3%| 位置 | 1975以來的變化 | 1990以來的變化 | 2000以來的變化 |
|---|---|---|---|
| Belmont, 麻省 | +27.6% | +9.8% | +2.3% |
| 麻省 | +20% | +9.8% | +3.1% |
| United States | +46.9% | +27.2% | +13.7% |
Belmont, 麻省平均年齡
平均年齡:42.1 年| 位置 | 年齡中位數 | 中位年齡(女) | 中位年齡(男) |
|---|---|---|---|
| Belmont, 麻省 | 42.1 年 | 42.9 年 | 41.2 年 |
| 麻省 | 39.2 年 | 40.6 年 | 37.8 年 |
| United States | 37.4 年 | 38.7 年 | 36.1 年 |
Belmont, 麻省人口樹狀圖
年齡和性別的人口| 年齡 | 男性 | 女性 | 總 |
|---|---|---|---|
| 5歲以下 | 787 | 695 | 1483 |
| 5-9 | 828 | 882 | 1710 |
| 10-14 | 843 | 910 | 1754 |
| 15-19 | 743 | 685 | 1429 |
| 20-24 | 396 | 438 | 835 |
| 25-29 | 514 | 592 | 1106 |
| 30-34 | 558 | 688 | 1247 |
| 35-39 | 734 | 820 | 1555 |
| 40-44 | 919 | 1020 | 1939 |
| 45-49 | 936 | 1062 | 1998 |
| 50-54 | 921 | 1047 | 1969 |
| 55-59 | 783 | 908 | 1691 |
| 60-64 | 677 | 813 | 1490 |
| 65-69 | 504 | 588 | 1093 |
| 70-74 | 373 | 422 | 796 |
| 75-79 | 312 | 357 | 669 |
| 80-84 | 219 | 330 | 550 |
| 85加 | 199 | 344 | 544 |
Belmont, 麻省人口密度
人口密度: 5062 / mi²| 位置 | 人口 | 區 | 人口密度 |
|---|---|---|---|
| Belmont, 麻省 | 23849 | 4.71 平方英里 | 5062 / mi² |
| 麻省 | 6.6 million | 10,554.4 平方英里 | 623.9 / mi² |
| United States | 321.6 million | 3,796,761.2 平方英里 | 84.7 / mi² |
Belmont, 麻省的歷史和預計人口
從1820到2100的估計人口Sources:
1. JRC (European Commission's Joint Research Centre) work on the GHS built-up grid
2. CIESIN (Center for International Earth Science Information Network)
3. [鏈接] Klein Goldewijk, K., Beusen, A., Doelman, J., and Stehfest, E.: Anthropogenic land use estimates for the Holocene – HYDE 3.2, Earth Syst. Sci. Data, 9, 927–953, https://doi.org/10.5194/essd-9-927-2017, 2017.
鄰近社區
Belmont企業(按街區分佈) Belmont Center: 28.2%
Belmont Hill: 23.6%
Cushing Square: 18.9%
Waverley Square: 14.9%
其他: 14.4%
Belmont, 麻省企業(按價格分佈)
中等: 61.7%
便宜: 23.3%
昂貴: 10.6%
非常昂貴: 4.4%
人類發展指數(HDI)
預期壽命,教育程度和人均收入的統計綜合指數。Sources: [Link] Kummu, M., Taka, M. & Guillaume, J. Gridded global datasets for Gross Domestic Product and Human Development Index over 1990–2015. Sci Data 5, 180004 (2018) doi:10.1038/sdata.2018.4
Belmont, 麻省二氧化碳排放
每年人均二氧化碳(CO2)排放量(噸)| 位置 | 二氧化碳排放量 | 人均二氧化碳排放量 | 二氧化碳排放強度 |
|---|---|---|---|
| Belmont, 麻省 | 457,561 美噸 | 19.2 美噸 | 97,137 tn/mi² |
| 麻省 | 99,725,154 美噸 | 15.1 美噸 | 9,448 tn/mi² |
| United States | 5,664,619,809 美噸 | 17.6 美噸 | 1,491 tn/mi² |
Belmont, 麻省二氧化碳排放
| 2013年二氧化碳排放量(噸/年) | 457,561 美噸 |
| 2013人均二氧化碳排放量(噸/年) | 19.2 美噸 |
| 2013二氧化碳排放強度(噸/平方英里/年) |
自然災害風險
相對風險(滿分10分)| 氣旋 | 高(8) |
| 洪水 | 高(8) |
| 地震 | 低 (2) |
*風險可能並不涉及整個地區,尤其是洪水或山體滑坡。
Sources: 1. Dilley, M., R.S. Chen, U. Deichmann, A.L. Lerner-Lam, M. Arnold, J. Agwe, P. Buys, O. Kjekstad, B. Lyon, and G. Yetman. 2005. Natural Disaster Hotspots: A Global Risk Analysis. Washington, D.C.: World Bank. https://doi.org/10.1596/0-8213-5930-4.
2. Center for Hazards and Risk Research - CHRR - Columbia University, Center for International Earth Science Information Network - CIESIN - Columbia University. 2005. Global Earthquake Hazard Distribution - Peak Ground Acceleration. Palisades, NY: NASA Socioeconomic Data and Applications Center (SEDAC). https://doi.org/10.7927/H4BZ63ZS.
3. Center for Hazards and Risk Research - CHRR - Columbia University, Center for International Earth Science Information Network - CIESIN - Columbia University, International Bank for Reconstruction and Development - The World Bank, and United Nations Environment Programme Global Resource Information Database Geneva - UNEP/GRID-Geneva. 2005. Global Cyclone Hazard Frequency and Distribution. Palisades, NY: NASA Socioeconomic Data and Applications Center (SEDAC). https://doi.org/10.7927/H4CZ353K.
4. Center for Hazards and Risk Research - CHRR - Columbia University, Center for International Earth Science Information Network - CIESIN - Columbia University. 2005. Global Flood Hazard Frequency and Distribution. Palisades, NY: NASA Socioeconomic Data and Applications Center (SEDAC). https://doi.org/10.7927/H4668B3D.
最近的附近地震
幅度3.0以上| 日 | 時間 | 大小 | 距離 | 深度 | 位置 | 鏈接 |
|---|---|---|---|---|---|---|
| 2015/1/12 | 凌晨3:36 | 3.3 | 93.6 公里 | 5,400 公尺 | 0km NE of Wauregan, Connecticut | usgs.gov |
| 1999/1/10 | 凌晨2:52 | 3.1 | 52 公里 | 2,000 公尺 | southern New England | usgs.gov |
| 1996/3/22 | 中午12:22 | 3.1 | 78.6 公里 | 11,900 公尺 | southern New England | usgs.gov |
| 1994/10/2 | 清晨7:36 | 3.3 | 85.7 公里 | 10,000 公尺 | southern New England | usgs.gov |
| 1994/10/2 | 凌晨4:27 | 3.7 | 90.6 公里 | 10,000 公尺 | southern New England | usgs.gov |
| 1977/12/25 | 清晨7:35 | 3.2 | 98.3 公里 | None | New Hampshire | usgs.gov |
| 1977/12/20 | 上午9:44 | 3.1 | 73.3 公里 | None | southern New England | usgs.gov |
| 1976/3/11 | 凌晨12:29 | 3.5 | 92.9 公里 | None | southern New England | usgs.gov |
| 1963/10/16 | 上午8:30 | 3.41 | 62.3 公里 | 14,000 公尺 | southern New England | usgs.gov |

關於我們的數據
此頁面上的數據是使用許多公共可用工具和資源估算的。它不提供任何保修,並且可能包含不正確的地方。使用風險自負。有關更多信息,請參見此處 。