- 世界
- »
- CA
- »
- 卑詩省
- »
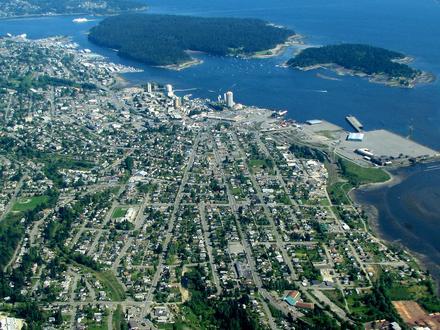
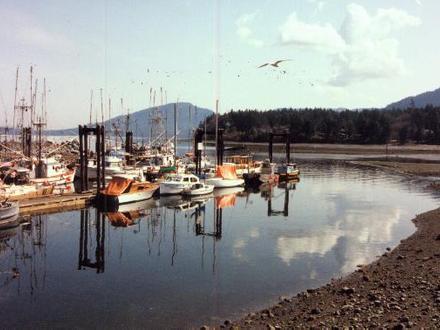
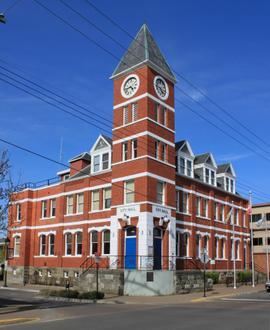
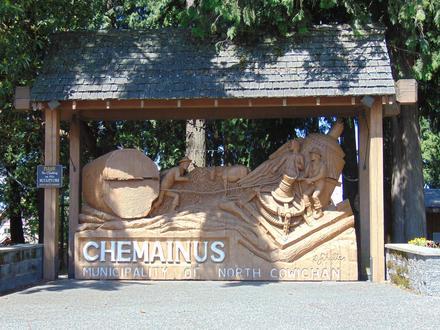
- Ladysmith, 卑詩省
在Ladysmith的企業
產業領域
行業分佈 購物中心: 16.6%
家庭服務: 10.6%
行業: 9.9%
專業服務: 8.1%
酒店&旅行: 7%
醫療: 6.9%
餐廳: 5.7%
汽車: 5.5%
其他: 29.6%
| 行業說明 | 機構數 | 平均營業年齡 | Google平均評分 | 每千名居民的業務 |
|---|---|---|---|---|
| 加油站 | 12 | 26.2 年 | 3.8 | 1.4 |
| 汽車維修 | 19 | 28.8 年 | 4.5 | 2.3 |
| 发型师 | 14 | 26.5 年 | 4.5 | 1.7 |
| 美容院 | 14 | 26.5 年 | 4.6 | 1.7 |
| 公共行政 | 10 | 29.5 年 | 4.8 | 1.2 |
| 藝術畫廊 | 9 | 4.9 | 1.1 | |
| 借貸公司 | 20 | 27.2 年 | 4.0 | 2.4 |
| 雜貨店和超市 | 25 | 31.6 年 | 4.3 | 3.0 |
| 其他建築 | 13 | 3.0 | 1.6 | |
| 房地產 | 9 | 1.1 | ||
| 總承包商 | 30 | 26.4 年 | 3.7 | 3.6 |
| 其他住宿 | 35 | 28.5 年 | 4.2 | 4.2 |
| 床和早餐 | 13 | 4.7 | 1.6 | |
| 度假屋,小木屋和度假村 | 8 | 27.5 年 | 4.3 | 1.0 |
| 酒店和汽車旅館 | 15 | 26.3 年 | 4.4 | 1.8 |
| 其他成員組織 | 9 | 4.4 | 1.1 | |
| 房屋建造 | 14 | 27.3 年 | 3.9 | 1.7 |
| 拖拉機和農用設備 | 7 | 4.5 | 0.8 | |
| 機械的批發 | 7 | 4.9 | 0.8 | |
| 兒童護理及日間護理 | 8 | 3.0 | 1.0 | |
| 健康和醫療 | 22 | 23.5 年 | 4.3 | 2.7 |
| 寵物美容及寄宿 | 7 | 26.5 年 | 4.6 | 0.8 |
| 專業設計 | 7 | 0.8 | ||
| 業務管理 | 8 | 1.0 | ||
| 教會 | 7 | 4.8 | 0.8 | |
| 酒吧,小酒吧和旅館 | 13 | 30.3 年 | 4.4 | 1.6 |
| 家用物品及設備 | 8 | 23.9 年 | 3.9 | 1.0 |
| 禮品,卡片和聚會用品 | 8 | 4.2 | 1.0 | |
| 購物-其他 | 21 | 27.8 年 | 4.4 | 2.5 |
| 辦公用品和文具商店 | 9 | 4.2 | 1.1 | |
| 公園 | 17 | 4.6 | 2.0 |
| Ladysmith, 卑詩省地區 | 12 平方公里 |
| 人口 | 8300 |
| 男性人口 | 3928 (47.3%) |
| 女性人口 | 4372 (52.7%) |
| 從1975到2015的人口變化 | +44.3% |
| 從2000到2015的人口變化 | +12.6% |
| 年齡中位數 | 48.4 |
| 男性平均年齡 | 47.9 |
| 女性平均年齡 | 48.8 |
| 電話區號 | 250, 780 |
| 當地時間 | 星期五 04:15 |
| 時區 | 北美太平洋夏令时间 |
| Facebook的 | Facebook資料 |
| 經度與緯度 | 48.99016° / -123.81699° |
| 郵編 | V9G |
Ladysmith, 卑詩省 -地圖
Ladysmith, 卑詩省人口
1975年到2015年| 數據 | 1975 | 1990 | 2000 | 2015 |
|---|---|---|---|---|
| 人口 | 5752 | 6810 | 7373 | 8300 |
| 人口密度 | 479.7 / km² | 568.0 / km² | 614.9 / km² | 692.2 / km² |
Ladysmith從2000到2015的人口變化
從2000年到2015年增長12.6%| 位置 | 1975以來的變化 | 1990以來的變化 | 2000以來的變化 |
|---|---|---|---|
| Ladysmith, 卑詩省 | +44.3% | +21.9% | +12.6% |
| 卑詩省 | +72.3% | +37.5% | +20.7% |
| 加拿大 | +55.8% | +30.2% | +17.2% |
Ladysmith, 卑詩省平均年齡
平均年齡:48.4 年| 位置 | 年齡中位數 | 中位年齡(女) | 中位年齡(男) |
|---|---|---|---|
| Ladysmith, 卑詩省 | 48.4 年 | 48.8 年 | 47.9 年 |
| 卑詩省 | 42.3 年 | 43.1 年 | 41.4 年 |
| 加拿大 | 40.6 年 | 41.5 年 | 39.6 年 |
Ladysmith, 卑詩省人口樹狀圖
年齡和性別的人口| 年齡 | 男性 | 女性 | 總 |
|---|---|---|---|
| 5歲以下 | 188 | 183 | 371 |
| 5-9 | 193 | 204 | 397 |
| 10-14 | 193 | 225 | 419 |
| 15-19 | 282 | 247 | 529 |
| 20-24 | 183 | 188 | 372 |
| 25-29 | 137 | 162 | 299 |
| 30-34 | 172 | 214 | 387 |
| 35-39 | 204 | 214 | 418 |
| 40-44 | 245 | 303 | 549 |
| 45-49 | 289 | 321 | 610 |
| 50-54 | 291 | 348 | 639 |
| 55-59 | 296 | 375 | 672 |
| 60-64 | 385 | 369 | 755 |
| 65-69 | 259 | 321 | 581 |
| 70-74 | 231 | 221 | 452 |
| 75-79 | 168 | 189 | 357 |
| 80-84 | 121 | 151 | 273 |
| 85加 | 90 | 136 | 227 |
Ladysmith, 卑詩省人口密度
人口密度: 692.2 / km²| 位置 | 人口 | 區 | 人口密度 |
|---|---|---|---|
| Ladysmith, 卑詩省 | 8300 | 12 平方公里 | 692.2 / km² |
| 卑詩省 | 4.8 million | 978,582 平方公里 | 4.86 / km² |
| 加拿大 | 35.5 million | 9,875,295.4 平方公里 | 3.6 / km² |
Ladysmith, 卑詩省的歷史和預計人口
從1890到2100的估計人口Sources:
1. JRC (European Commission's Joint Research Centre) work on the GHS built-up grid
2. CIESIN (Center for International Earth Science Information Network)
3. [鏈接] Klein Goldewijk, K., Beusen, A., Doelman, J., and Stehfest, E.: Anthropogenic land use estimates for the Holocene – HYDE 3.2, Earth Syst. Sci. Data, 9, 927–953, https://doi.org/10.5194/essd-9-927-2017, 2017.
Ladysmith, 卑詩省企業(按價格分佈)
便宜: 42.9%
中等: 31%
非常昂貴: 16.7%
昂貴: 9.5%
人類發展指數(HDI)
預期壽命,教育程度和人均收入的統計綜合指數。Sources: [Link] Kummu, M., Taka, M. & Guillaume, J. Gridded global datasets for Gross Domestic Product and Human Development Index over 1990–2015. Sci Data 5, 180004 (2018) doi:10.1038/sdata.2018.4
Ladysmith, 卑詩省二氧化碳排放
每年人均二氧化碳(CO2)排放量(噸)| 位置 | 二氧化碳排放量 | 人均二氧化碳排放量 | 二氧化碳排放強度 |
|---|---|---|---|
| Ladysmith, 卑詩省 | 120,885 美噸 | 14.6 美噸 | 10,082 tn/km² |
| 卑詩省 | 68,179,723 美噸 | 14.3 美噸 | 69.7 tn/km² |
| 加拿大 | 521,999,336 美噸 | 14.7 美噸 | 52.9 tn/km² |
Ladysmith, 卑詩省二氧化碳排放
| 2013年二氧化碳排放量(噸/年) | 120,885 美噸 |
| 2013人均二氧化碳排放量(噸/年) | 14.6 美噸 |
| 2013二氧化碳排放強度(噸/平方公里/年) | 10,082 tn/km² |
自然災害風險
相對風險(滿分10分)| 滑坡 | 平均值(6) |
| 地震 | 平均值(6) |
*風險可能並不涉及整個地區,尤其是洪水或山體滑坡。
Sources: 1. Dilley, M., R.S. Chen, U. Deichmann, A.L. Lerner-Lam, M. Arnold, J. Agwe, P. Buys, O. Kjekstad, B. Lyon, and G. Yetman. 2005. Natural Disaster Hotspots: A Global Risk Analysis. Washington, D.C.: World Bank. https://doi.org/10.1596/0-8213-5930-4.
2. Center for Hazards and Risk Research - CHRR - Columbia University, Center for International Earth Science Information Network - CIESIN - Columbia University. 2005. Global Earthquake Hazard Distribution - Peak Ground Acceleration. Palisades, NY: NASA Socioeconomic Data and Applications Center (SEDAC). https://doi.org/10.7927/H4BZ63ZS.
3. Center for Hazards and Risk Research - CHRR - Columbia University, Center for International Earth Science Information Network - CIESIN - Columbia University, and Norwegian Geotechnical Institute - NGI. 2005. Global Landslide Hazard Distribution. Palisades, NY: NASA Socioeconomic Data and Applications Center (SEDAC). https://doi.org/10.7927/H4P848VZ.
最近的附近地震
幅度3.0以上| 日 | 時間 | 大小 | 距離 | 深度 | 位置 | 鏈接 |
|---|---|---|---|---|---|---|
| 2018/6/8 | 上午10:09 | 3.19 | 48.3 公里 | 58,210 公尺 | 20km SSW of Point Roberts, Washington | usgs.gov |
| 2018/2/3 | 晚上10:57 | 3.09 | 64.8 公里 | 12,690 公尺 | 13km NW of Friday Harbor, Washington | usgs.gov |
| 2017/1/30 | 凌晨3:03 | 3.09 | 69.1 公里 | 14,590 公尺 | 9km NNW of Friday Harbor, Washington | usgs.gov |
| 2016/4/4 | 上午11:36 | 3.1 | 82 公里 | 5,000 公尺 | 30km NNE of Sechelt, Canada | usgs.gov |
| 2015/12/29 | 晚上11:39 | 4.79 | 58.8 公里 | 52,420 公尺 | 17km NNE of Victoria, Canada | usgs.gov |
| 2015/2/14 | 晚上8:12 | 3.4 | 83.9 公里 | 3,410 公尺 | 32km NNE of Sechelt, Canada | usgs.gov |
| 2014/12/11 | 清晨6:53 | 3.2 | 53.8 公里 | 65,800 公尺 | 17km W of Sechelt, Canada | usgs.gov |
| 2014/6/16 | 下午1:40 | 3.01 | 66 公里 | 23,851 公尺 | 11km NE of Victoria, Canada | usgs.gov |
| 2012/12/26 | 晚上10:36 | 3.96 | 56 公里 | 54,491 公尺 | San Juan Islands region, Washington | usgs.gov |
| 2012/8/29 | 下午3:20 | 3.3 | 55.8 公里 | 26,500 公尺 | Washington-British Columbia border region | usgs.gov |
查找Ladysmith, 卑詩省附近的歷史地震事件
最早日期 最新日期
幅度3.0以上 幅度4.0及更高 震級5.0以上
關於我們的數據
此頁面上的數據是使用許多公共可用工具和資源估算的。它不提供任何保修,並且可能包含不正確的地方。使用風險自負。有關更多信息,請參見此處 。